Animations of Population Pyramids
These graphics reveal the age and gender distribution based on the cohort fertility rate of populations.
France | United States | China | India
![]()
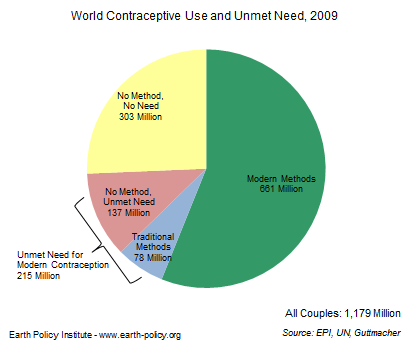
The graphical display of complex information is important but difficult to do really well.
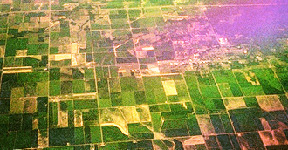
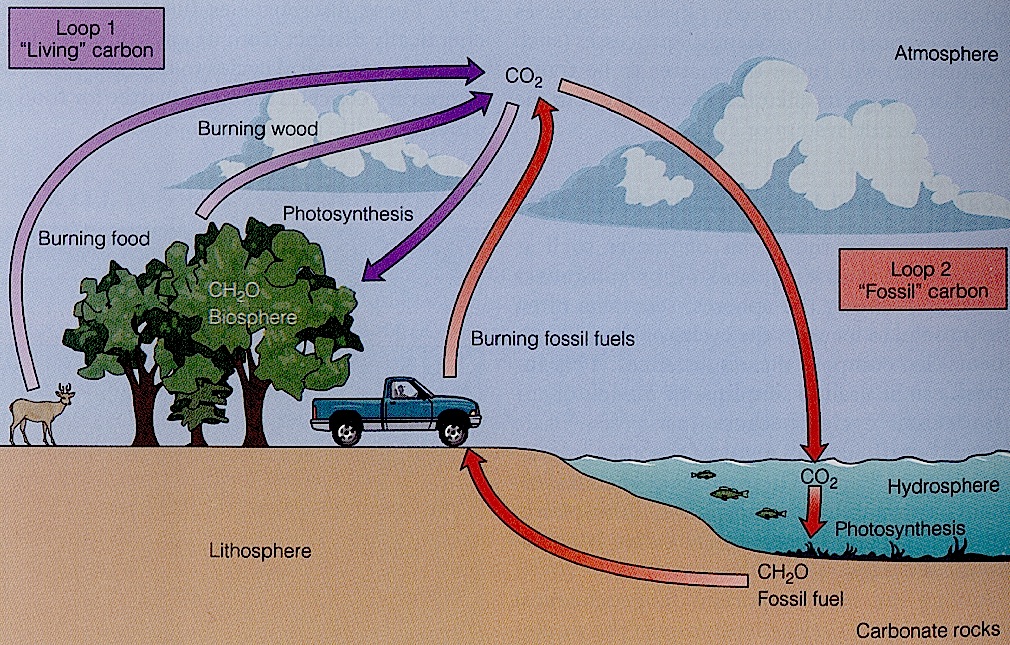
The number of organisms in a designated area is a population that is part of a functional process of chemical cycles.
Make your own population pyramids with Microsoft excel
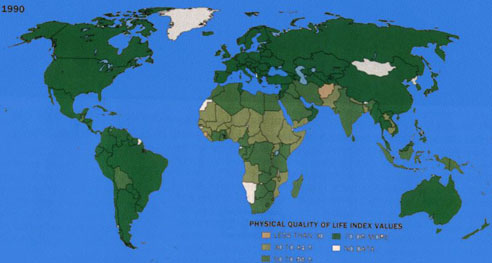
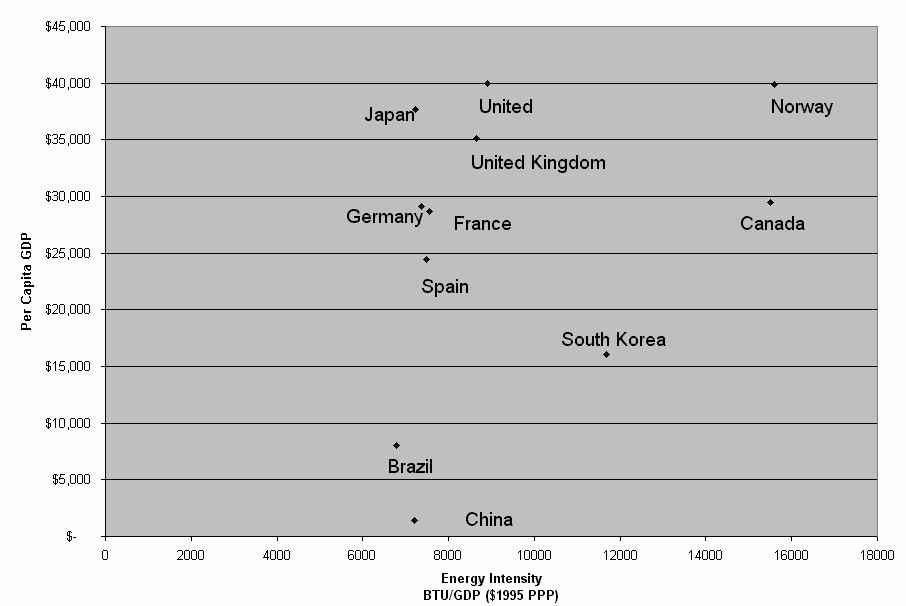
France | China | United States | PQL=physical quality of life | Europe | Energy used per GDP | World population growth
![]()
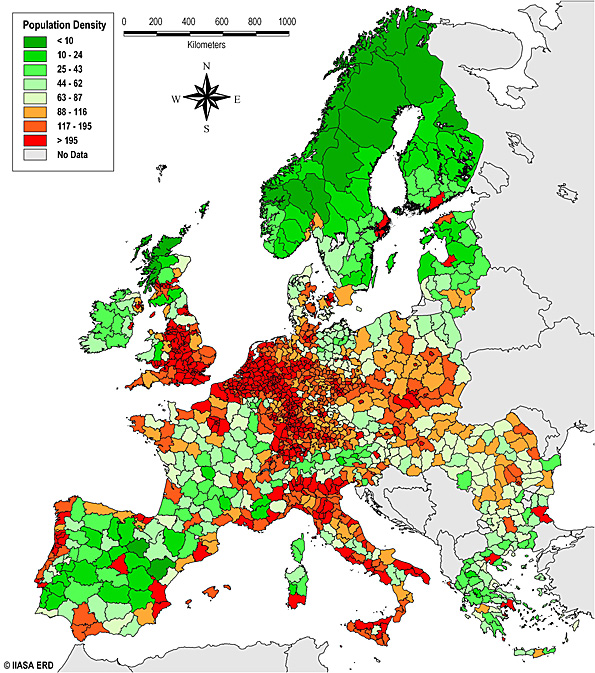
Europe
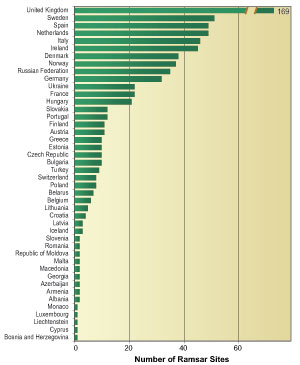
Countries and wildlife areas in protected wetlands by nations.
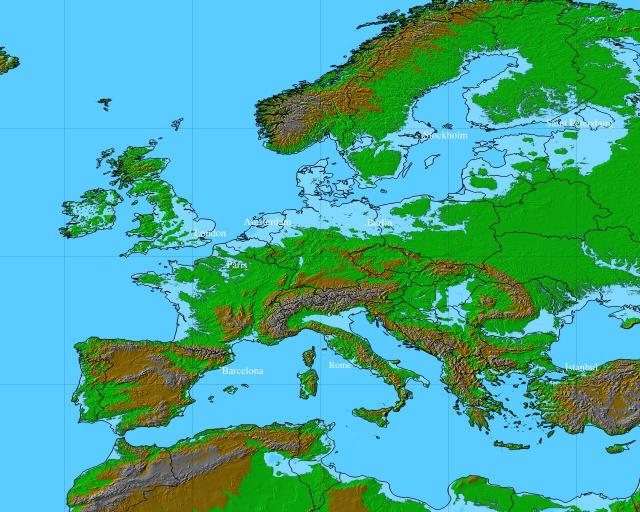
European Union population density.
![]()
France | United States | China | PQL=physical quality of life | Energy used per GDP | World population growth
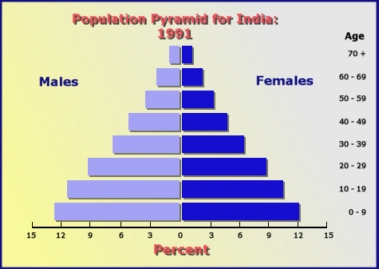
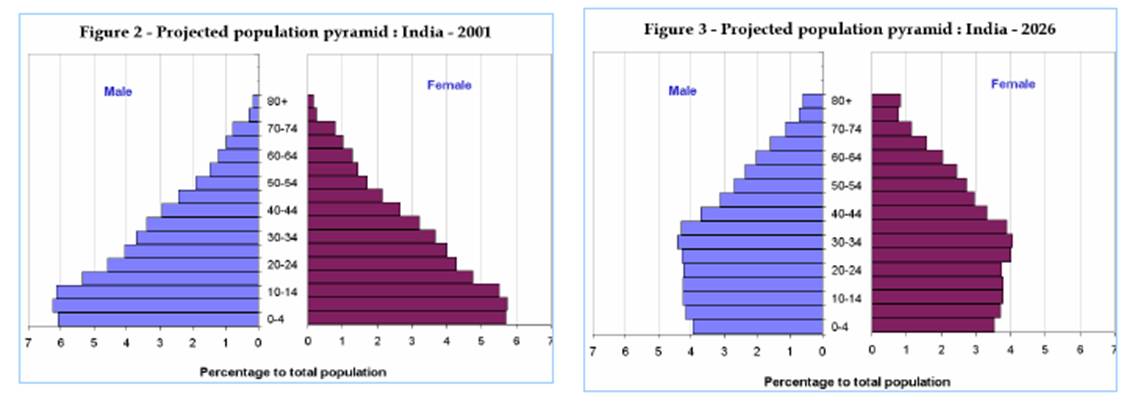
Population profiles:
Graphically dynamic depictions of how nation's population cohorts change decade by decade.
France | United States | China | India
 France
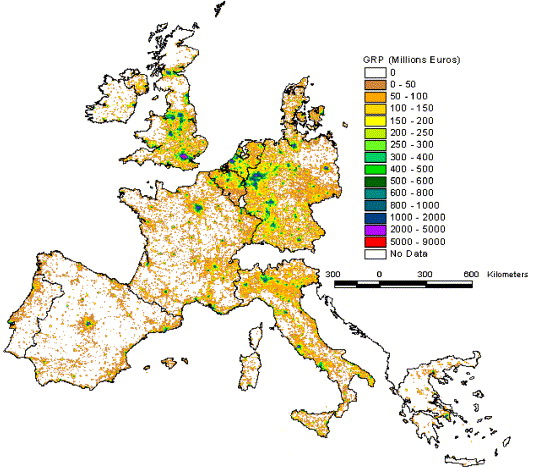
European Union economic prosperity.
![]()
France | United States | China | PQL=physical quality of life | Energy used per GDP | World population growth
![]()
China
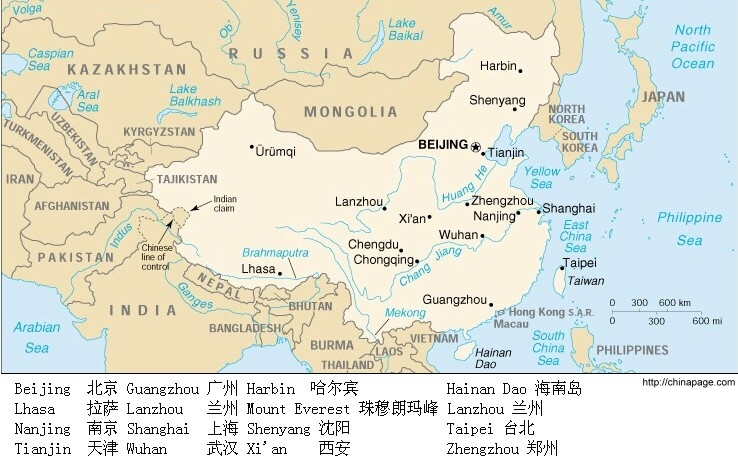
Changes in China's population in fifty years.
http://www.iiasa.ac.at/Research/SRD/ChinaFood/data/anim/pop_ani.htm
![]()
France | United States | China | PQL=physical quality of life | Energy used per GDP | World population growth
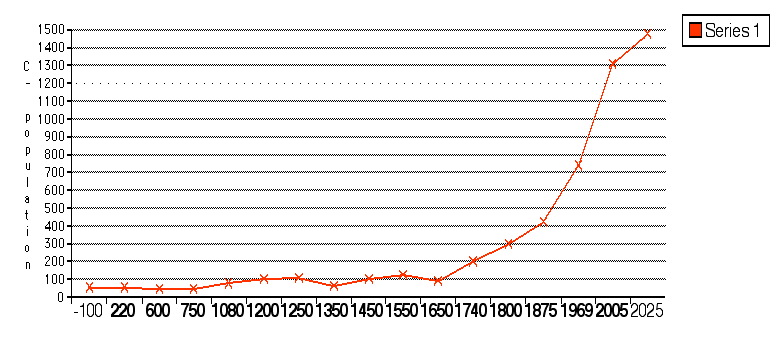
Growth of Chinese population 100 BCE to today.
![]()
France | United States | China | PQL=physical quality of life | Energy used per GDP | World population growth![]()
USA 
 |
| This animated population pyramid shows both age and gender of the United States population. |
What makes this graph interesting is the animation that shows the transformation of the population over one hundred years from 1950 to 2050.
http://www12.statcan.ca/english/census01/products/analytic/companion/age/cda01pymd.cfm