 Boom & Bust
What are the facts about boom & bust cycles?
 Zeit, meaning "the
times" in German; zeitgeist– the mood of a period.
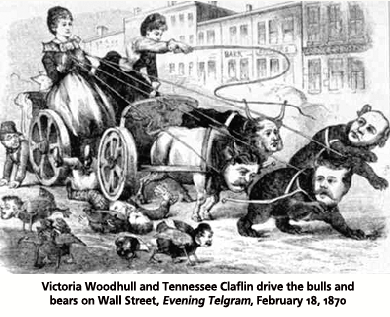
A bear and a bull are shown cheek to jowl in this cartoon depicting the legendary relation between market downturns when scarcity dominates symbolized by the bear and the bright up turns in the markets symbolized by the bull. The bear stands for a bust and the bull stands for the boom. 1
A boom is the accelerating part of an economic cycle and the bust is the collapse or decelerating part of that cycle. Busts have been referred to historically as, panics, bubbles, recessions, and depressions. These terms are frequently used to economic down-turns in market activity referring to different characteristics of these rise and fall in prices, wages, and commercial activity.
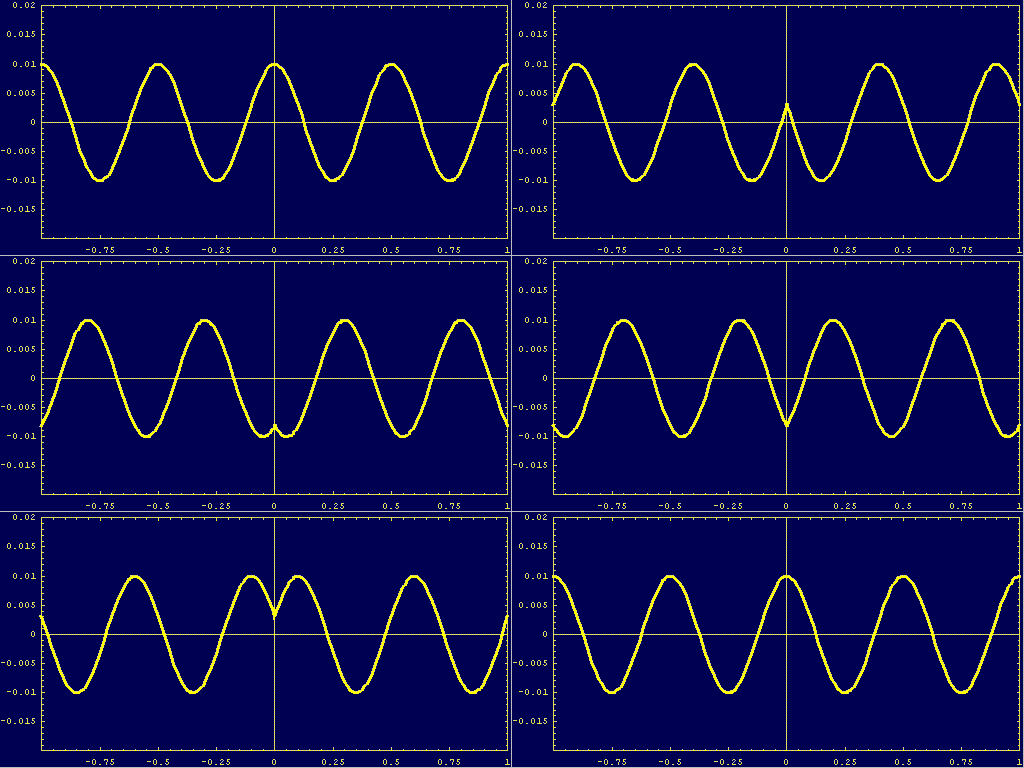
It is as if mercantile cycles were a wave:
 This is a wave pulsating through a population's social and economic relationships formed by the combined actions and investment decisions of workers, owners, speculators, consumers, and policy makers or enforcers based on the aggregate behavior all buyers and sellers over time.
The high point is the crest of the boom, the trough is the low-point, or bottom of the bust.
A cyclical behavior pattern: waves of commercial scarcity and glut in American economic history.
|
recessions: | years elapsed | cycle length | related events |
|
1784 | 23 | 35 | revolt & war |
|
1819 | 33 | 18 | Land sales |
|
1837 | 18 | 20 | 2d National Bank. [3] |
|
1857 | 20 | 16 | Railroads |
|
1873 | 16 | 19 | Credit Mobilier |
|
1892 | 19 | 15 | resources |
|
1907 | 15 | 22 | fuel (coal) speculation |
|
1929 | 22 | 28 | financial speculative collapse |
|
1957 | 28 | 32 | world trade |
| 10 | 1990 2 | 32 | 10 | stock speculation |
| 2008 4 | 20 | 2 | Housing speculative bubble |
Duration of recessions
| cycle |
|
|
|---|---|---|
| minimal: | 10 to 25.1 years. | 7.59 years. |
| maximum: | 35 to 25.3
|
|
1. ERP {Equity Risk Premium} serves as an indicator of valuation bubbles when it plunges significantly into negative territory, as it did so in the recent past.
2. The ERP did so in the 1987 market crash and the Dot.com Bubble of the late 1990s.
3. The Flour Riot of 1837 was a social disturbance that broke out in New York City in 1837. The riot was triggered by a combination of the rising cost of flour, which had increased from $5.62 a barrel (196 lb. or 88.90 kg) to $12 a barrel and the panic of 1837.
4. "Lasting from December 2007 to June 2009, this economic downturn was the longest since" 1945 officially measured to have lasted 19 months. The Fedreal Reserve Bank History
Technology index ![]() landscape index
landscape index ![]() words index
words index ![]() map index
map index ![]() photograph index
photograph index
Date: 12 -8-08 *&* 10-1-2015

.gif)


