"Tomorrow's Climate is Today's Challenge"
 The current climate change drivers1 are an accumulation of carbon dioxide and similar heat-trapping gases at a rate in excess of the capacity of vegetation and oceans to take-up, or assimilate this exhaust of these thermally-active, vapor gases in the air. These consistent readings since 1958 are "defined as the number of molecules of carbon dioxide divided by the number of all molecules in air, including CO2 itself, after water vapor has been removed. The mole fraction is expressed as parts per million (ppm).
Carbon Saturation | Mauna Loa readings | Sources | Keeling's work | Earliest Evidence | Graphs | Vostok core
Example: 0.000400 is expressed as 400 ppm." 2
"The monitoring of C02 at the South Pole and at Mauna Loa provide the two longest-running historical records.... In the late 1950s, the the CO2 concentration was about 315 ppm at both sites. Fifty years later, the CO2 concentration at Mauna Loa was about 385 ppm, while at the South Pole was 382 ppm... the concentration increased by 22 percent.... the rise in CO2 appears to be truly global."
pp. 36-37. CO2 Rising: The World's Greatest Environmental Challenge, Tyler Volk. Cambridge, Mass. MIT Press, 2008.
Global warming driven climate change
Carbon Saturation | Mauna Loa readings | Sources | Keeling's work | Earliest Evidence | Graphs | Vostok core
Earth station: Mauna Loa mountain top, in Hawaii.
402.48 ppm as of January 2016.
 Our planet is a dynamic system that changes over time at different rates. Geologically slow movements of the plates on which continents move is at one extreme of a spectrum of differing rates of change. The accumulation of heat trapping gas since 1958 is at the other extreme revealing very fast rates with which vegetation and animals may find it daunting to adapt.
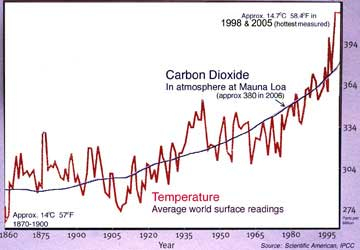
The graph
below displays a 44 year measurement of carbon dioxide and over a 22 percent increase in those
years over the base year of 1958. Recent evidence reveals a 40% increase in carbon dioxide trace gas since 1800.
2% average at the high end and 1.36% average at the lower end for the yearly increase
of carbon dioxide over four decades, are further examples of a very rapid rate of atmospheric and oceanic changes on earth.
Carbon Saturation | Mauna Loa readings | Sources | Keeling's work | Earliest Evidence | Graphs | Vostok core
 396.18 ppm was the level of carbon dioxide (CO2) in the atmosphere in Hawaii in April 2012 and 393.87 ppm, globally. [March 2012] See NOAA.
The mean reading for August [September 29,] 2013, is 396 ppm.
By November the atmospheric high was 400 ppm according to NASA readings.
February, 2014 at 398.3 ppm and on March 19 topped 400 ppm.
Current level?
The isotope ratios of carbon.
Sources:
Footnote. #1,
"C. Drivers of Climate Change
Natural and anthropogenic [human generated] substances and processes that alter the Earth's energy budget are drivers of climate change. Radiative forcing14 (RF) quantifies the change in energy fluxes caused by changes in these drivers for 2011 relative to 1750, unless otherwise indicated. Positive RF leads to surface warming, negative RF leads to surface cooling. RF is estimated based on in-situ and remote observations, properties of greenhouse gases and aerosols, and calculations using numerical models representing observed processes. Some emitted compounds affect the atmospheric concentration of other substances. The RF can be reported based on the concentration changes of each substance15. Alternatively, the emission-based RF of a compound can be reported, which provides a more direct link to human activities. It includes contributions from all substances affected by that emission. The total anthropogenic RF of the two approaches are identical when considering all drivers. Though both approaches are used in this Summary, emission-based RFs are emphasized. Total radiative forcing is positive, and has led to an uptake of energy by the climate system. The largest contribution to total radiative forcing is caused by the increase in the atmospheric concentration of CO2 since 1750."
(see Figure SPM.5). {3.2, Box 3.1, 8.3, 8.5} AR5 IPCC Fifth Assessment Report, Sept. 2013. Page SPM-8
footnote. #2,
Trends in Atmospheric Carbon Dioxide, NOAA, August 2013
How to reference content from this page ?
Dr. Pieter Tans, NOAA/ESRL (www.esrl.noaa.gov/gmd/ccgg/trends/) and Dr. Ralph Keeling, Scripps Institution of Oceanography (scrippsco2.ucsd.edu/).
http://www.esrl.noaa.gov/gmd/ccgg/trends/
earth change monitoring | long term ecological research | close
to home
Carbon Saturation | Mauna Loa readings | Sources | Keeling's work | Earliest Evidence | Graphs | Vostok core
"David Keeling was
living proof that a scientist could, by sticking close to his bench, change
the world.”
 Charles
David Keeling, noted JIMO researcher, was awarded the National Medal of
Science in a White House presentation on 13 June 2002 for his lifetime achievement in scientific research.
His significant studies of the carbon cycle and the increase of atmospheric CO2, have been a pivotal marker
in the study of global climate change.
Charles
David Keeling, noted JIMO researcher, was awarded the National Medal of
Science in a White House presentation on 13 June 2002 for his lifetime achievement in scientific research.
His significant studies of the carbon cycle and the increase of atmospheric CO2, have been a pivotal marker
in the study of global climate change.
Keeling's scientific contributions have affected the scientific, economic
and social challenges which confront us today and well into the future. Keeling was the first to model the accumulation of atmospheric carbon dioxide.
The "Keeling curve" encapsulates 45 years of time of series measurements of atmospheric carbon dioxide
taken atop Mauna Loa, Hawaii. His data confirmed that the increased accumulation of carbon dioxide
produced by burning fossil fuels and other industrial products, contributed to the greenhouse effect. Under Keeling's
current JIMO research, which is a continuum of his lifetime study of the global carbon cycle, he is
developing measurement techniques in analyzing Ar / N2 (Argon-Nitrate) ratios.
Carbon Saturation | Mauna Loa readings | Sources | Keeling's work | Earliest Evidence | Graphs | Vostok core
Accumulating
evidence
The "Keeling Curve" confirms a steady increase in carbon dioxide levels contributing to the greenhouse effect.
Carbon Saturation | Mauna Loa readings | Sources | Keeling's work | Earliest Evidence | Graphs | Vostok core

Details of Keeling's life and work.
Besides his interests in atmospheric chemistry and geochemistry, his comprehensive
study of the effects of tidal mixing on climate change spans a 1,000-year period. According to Keeling, strong
oceanic tides are the engines behind the warming-cooling cycle that may help determine future climate change.
Born in Scranton, Pennsylvania, Keeling received his B.A. degree in chemistry
from the University of Illinois in 1948 and a Ph.D. in chemistry from Northwestern University in 1954. Keeling
joined the Scripps Institution of Oceanography in 1956. He is a fellow of the American Academy of Arts and Sciences,
the American Geophysical Union, the American Association for the Advancement of Sciences, and the National
Academy of Sciences.
| Obituary |
Pioneering climate
scientist Charles David Keeling died on Monday, June 20, 2005. Keeling was
best known for his precise measurements of atmospheric carbon dioxide,
charted above in the Keeling curve, one of the most recognizable images
in modern science. |
The measurements show the steady rise of carbon dioxide levels in the
atmosphere over a forty seven year period (1958-2005). Regular wobbles
reflect the inhalation and exhalation of the Earth as plants grow, absorbing
carbon in the summer and spring, and decay, releasing carbon in the fall
and winter. The measurements shown in this curve represent the world’s
longest continuous record of atmospheric carbon dioxide and were the first
to confirm the rise of atmospheric carbon dioxide released from the burning
of fossil fuels. As such, this is considered to be among the most important
time-series data sets for the study of global climate change. |
 |
In a June 22 press release from the Scripps Institution of Oceanography
— the organization that funded Keeling’s work and with which
Keeling had been affiliated since 1956 — the current director, Charles
F. Kennel, praised Keeling’s research with the following words: “Charles
David Keeling’s measurements of the global accumulation of carbon
dioxide in the atmosphere set the stage for today’s profound concerns
about climate change. They are the single most important environmental
data set taken in the 20th century.
As the amount of carbon dioxide in the air and oceans increases the capacity for these bodies to retain heat, also increases. Current CO2 levels are 393.6 parts per million [2-2012], an 800,000 year zenith or high point.
|
The
data were collected at the Mauna Loa Observatory, perched 3,397 meters
(11,140 feet) above sea level on the northern slopes of Earth’s largest
volcano, away from dense vegetation or human population that might skew
the measurements. The bare volcanic landscape surrounding the observatory
is shown in the photo inset. |
|
 |
Keeling received the National
Medal of Science, the United States’ highest award for lifetime achievement
in scientific research, the Tyler Prize for Environmental Achievement, and many
other awards for his work. To read more about his life and research, see “Climate Science Pioneer: Charles David Keeling” on the Scripps Institution of Oceanography
web site.
earthobservatory.nasa.gov/
Newsroom/NewImages/...
Carbon Saturation | Mauna Loa readings | Sources | Keeling's work | Earliest Evidence | Graphs | Vostok core
Related concepts:
- Prairie
types in North America as an example of anticipated responses due to loss
of soil moisture, irregular precipitation and temperature changes; the expanse of grasslands, at the expense of forests are one anticipated consequence of unstable weather patterns and rising overall temperatures, in part due to soil moisture decline that selects for grasses with immense root systems.
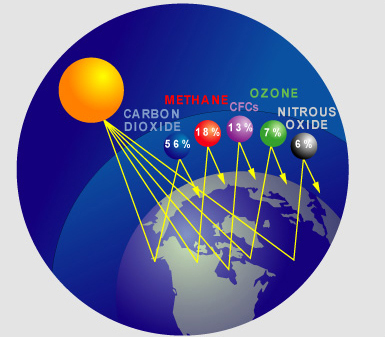
- The evidence is:
"Humans enhance the greenhouse effect directly by emitting greenhouse gases such as CO2, CH4, N2O, and chlorofluorocarbons (CFC) (Figure 1.1). In addition, pollutants such as carbon monoxide (CO), volatile organic compounds (VOC), nitrogen oxides (NOx) and sulfur dioxide (SO2), which by themselves are negligible GHGs, have an indirect effect on the greenhouse effect by altering, through atmospheric chemical reactions, the abundance of important gases to the amount of outgoing LWR [Long Wave Radiation{heat}] such as CH4 and ozone (O3), and/or by acting as precursors of secondary aerosols. Since anthropogenic emission sources simultaneously can emit some chemicals that affect climate and others that affect air pollution, including some that affect both, atmospheric chemistry and climate science are intrinsically linked."
Further evidence is:
"The increase in atmospheric CO2 concentration is known to be caused by human activities because the character of CO2 in the atmosphere, in particular the ratio of its heavy to light carbon atoms, has changed in a way that can be attributed to addition of fossil fuel carbon. In addition, the ratio of oxygen to nitrogen in the atmosphere has declined as CO2 has increased; this is as expected because oxygen is depleted when fossil fuels are burned. A heavy form of carbon, the carbon-13 isotope, is less abundant in vegetation and in fossil fuels that were formed from past vegetation, and is more abundant in carbon in the oceans and in volcanic or geothermal emissions.
. . .
The relative amount of the carbon-13 isotope in the atmosphere has been
declining, showing that the added carbon comes from fossil fuels and vegetation.
. . .
Carbon also has a rare radioactive isotope, carbon-14, which is present in atmospheric CO2 but absent in fossil fuels."
NOAA, Ocean Services . . . .
Source:
IPCC, 2007: Climate Change 2007: The Physical Science Basis. Contribution of Working Group I to the Fourth Assessment Report of the Intergovernmental Panel on Climate Change.
[Solomon, S., D. Qin, M. Manning, Z. Chen, M. Marquis, K.B. Averyt, M.Tignor and H.L. Miller (eds.)]. Cambridge University Press, Cambridge, United Kingdom and New York, NY, USA. Part 7-1.
Frequently Asked Questions
Climate change, politics of.
Carbon Saturation | Mauna Loa readings | Sources | Keeling's work | Earliest Evidence | Graphs | Vostok core
Links
http://astro.wsu.edu/worthey/earth/html/md-climate.html
National Academy of Science: NAS
Council Statement on a 1998 Petition concerning Global Climate Change
Energy Star program http://www.energystar.gov
U.S. EPA: Climate change impacts on the over seventy million people in the southeastern USA.
IFAS: Global Warming: Climate Change and Florida
FICUS: Florida Center for Community Design and Research
NOAA: current levels of carbon dioxide at Mauna Loa observatory.
Climate as a global commons in collision. 2012.
Archer | Christianson | Gelbspan | James Hansen, 04 : Hansen
06 | Leggett | Lohman | McKibben| Musil | Prinn | Schmidt | Weart | Wigley
