Rise in CO2 | ENSO periodicity | defining ENSO | contrasts | strongest El Niño years | Economic cycles | factor summary
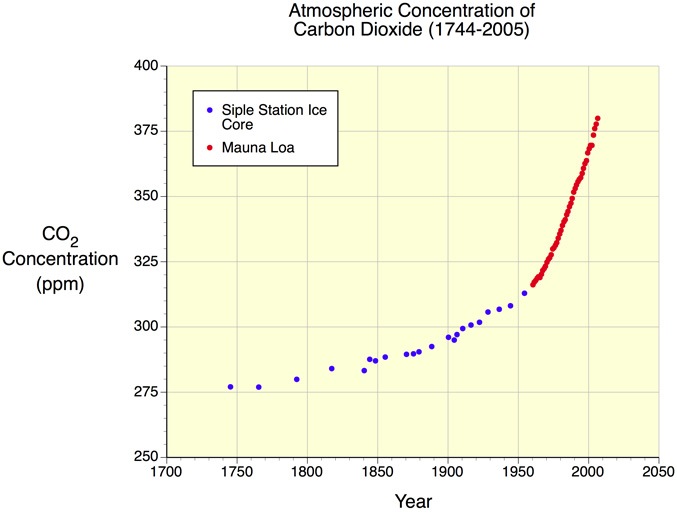
Among the lowest annual emission rates of carbon dioxide in parts per million are these seven out of 45 years:
1960 • 1964 • 1970-1971 • 1974 • 1982 • 1992 • 1999
Graphic 1.
| Year | ppm | ENSO + El Niño |
ENSO - La Niña |
U.S. Economy | |
|---|---|---|---|---|---|
1960 |
0.50 |
cooler | recession: 4/60-2/61 |
||
1964 |
0.30 |
moderate warming | |||
1970 |
1.00 |
moderate cooler | recession until 11/70 |
||
1971 |
0.78 |
weak cooler | |||
1974 |
0.76 |
weak cooler | recession until 3/75 |
||
1982 |
0.71 |
strong warming | recession until 11/82 |
||
| 1992 | 0.45 |
warmer | recession ended 3/91 |
||
| 1999 | 0.91 |
strong cooler |
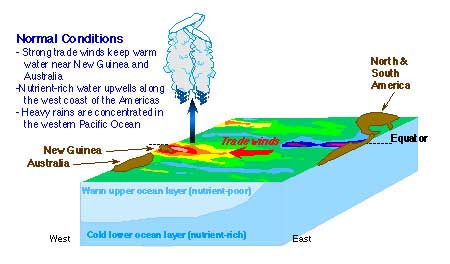
ENSO is the El Niño, Southern Ocean oscillation between El Niño or warm wet years in the Americas and La Niña or colder, drier years in the Americas, based on the heat capacity of the Indian Ocean and the failures of the East Indian monsoons that have a periodic frequency.
Graphic 2.
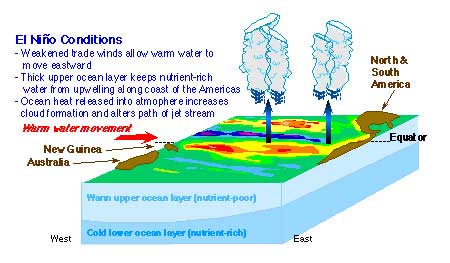
The contrasts between prevailing and anomalous El Niño conditions in the equatorial Pacific Ocean
See for a list since 1950s of El Niño and La Niña events.
The annual average increase in carbon in the atmosphere over twenty years (1985-2005) is 1.70 while the forty-five year average increase is 1.39 from 1959-2005.
What factors account for the decline of the ENSO in those eight selected years, or five out of forty-five years?
"For the past several decades, about half of all years have experienced La Nada conditions, compared to about 20 percent for El Niño and 30 percent for La Niña."
"'Neutral infers something benign, but in fact if you look at these La Nada years when neither El Niño nor La Niña are present, they can be the most volatile and punishing. As an example, the continuing, deepening drought in the American West is far from 'neutral,' he said."
NASA/JPL
Alan Buis,"'La Nada' climate pattern lingers in the Pacific," NASA's Jet Propulsion Laboratory NASA News, September 9, 2013.
| ENSO is the El Niño Southern Ocean oscillation meaning the periodic warming and cooling of the surface waters of the Pacific Ocean due to its geographical situation with respect to the usually warmer Indian Ocean. | ||
| Graphic 3. | ||
| Indian Ocean | |
East Pacific Ocean |
| By sliding the mouse over the graphic compare the changes in mid-ocean during the ENSO cycles. | ||
El Niño or warm wet years were strongest in:
1957
1965
1972
1982
1997
Recessions in the US: 1948-49 to 2001-02
The years of economic downturns were:
1957-58 for eight months
1960- 61 for eleven months
1969-70 for twelve months
1973-75 for seventeen months
1980 for seven months
1981-82 for sixteen months
1990-1991 for nine months
2001 for eight months
National Bureau of Economic Research
Graphic 2: recession years ◊ and climate variability
...............................◊..◊......◊..........◊◊...◊◊◊.........◊◊................◊.....................◊.................................◊
There were 88 months of recession (◊ above) in 44 years since 1957 with an average of 11 months duration and sixteen percent of those 43 years were recession periods based on the months during which recessions happened. Red indicates warmer and blue cooler periods.
If recessions affect production of carbon emitting industrial processes, then recessions may account for all but three (1964, 1971, 1999) of the low emission years from 1960-2005.
But do these times of prosperity coincide with high emission rates?
Deforestation rates and vulcanism are also important variables to consider.
There is little positive correlation between economic activity and the response of ENSO cycles to the decline in per capita emissions.
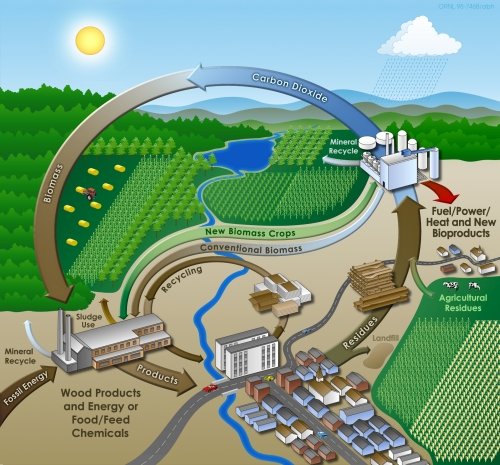
By closing the production and exhaust loops reuse would reduce excessive carbon dioxide accumulation.
US Census Bureau (decennial census data)
Population pyramids - dynamic change
We live within, not on; entwined with the biological wealth of – the world.
![]()
Rise in CO2 | ENSO periodicity | defining ENSO | contrasts | strongest El Niño years | Economic cycles | factor summary

Archer | Christianson | Gelbspan | James Hansen, 04 : Hansen 06 | McKibben| Musil | Schmidt | Weart | Wigley
![]()
Technology index ![]() landscape index
landscape index ![]() words index
words index ![]() photograph index
photograph index
This button below works as a navigational aid.
gallery | site-serach | back to population | Web site's themes
schedule | Research home | Atlas | sources-authors | Ecology | laws | reliable web sites | quick look
Science Index | Site Analysis | Landscape Index | Global Warming Index | Nature Index | Research sites | Genes
Terms | Glossary | Word webs | Basic vocabulary | Advanced Vocabulary | Antonyms | Synonyms | Etymology | Concepts
Writing | Interviews | Free Writing