 Maps
as means of knowing
Maps
as means of knowing.gif)


The map will reveal the shape, not the terrain of the territory |
||
|
||
|
|
|
|
||
The great meridian | density | mapping coastal pollution | frontier | land-use | energy-use | utility pollution | solar | high hazard areas
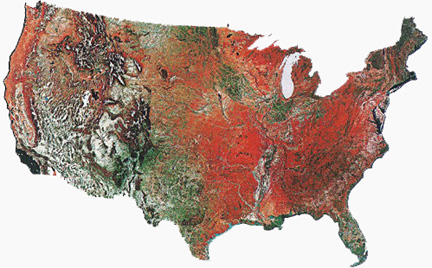
Satellite Map of the USA in 1990
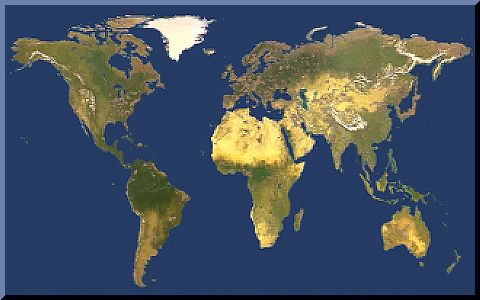
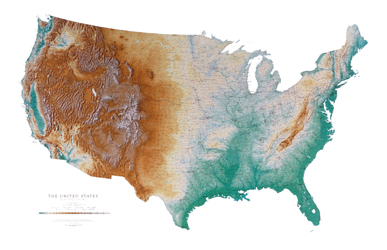
The red on the map at left is forested area shown in red and the green is grassland vegetation. That map is a composite of satellite images taken in the infrared range of the electromagnetic spectrum. That map on the right is a physical representation of the nation's elevations and principle mountain systems; the lower lying areas are in green.
Find the middle of Texas and identify the black vertical band that forms an imaginary line from top to bottom of this image, The line running from north to south, that you should draw on the printout of this map above is the 100th Meridian.
The one hundredth meridian, or line of longitude is the imaginary demarcation between the arid --nearly rainless-- west and the more humid east where there is ample rainfall for farming to occur.
The great meridian | N.A. density | mapping coastal pollution | land-use | energy-use | utility pollution | solar | high hazard areas
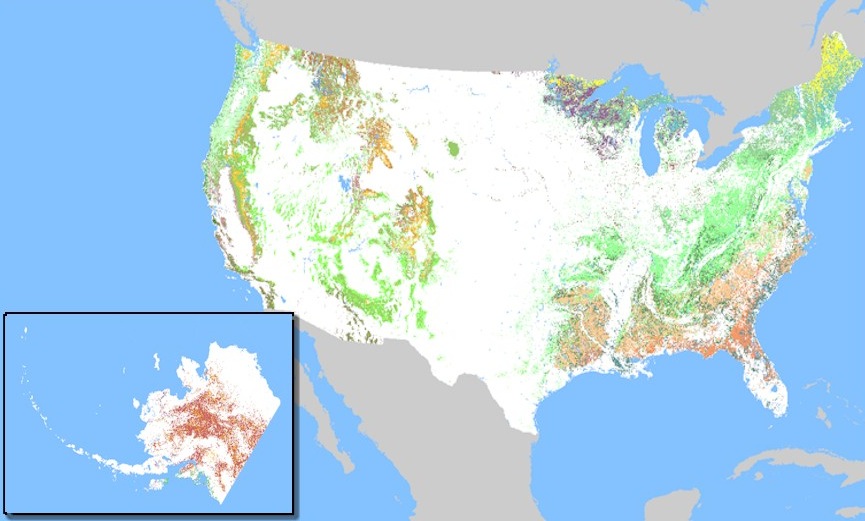
United State historical census data 1790-2010
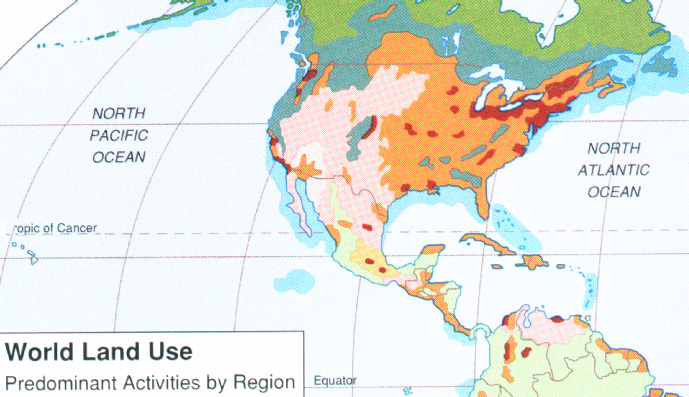
The red or maroon areas on this map below is heavily populated areas shown surrounded by agricultural areas in orange hues and tall forests in blue; the green is tundra, or a form of lichen and intermixed short brush with grassland vegetation. Grazing and mountain lands are shown in the pinkish hue
 |
 |
|---|---|
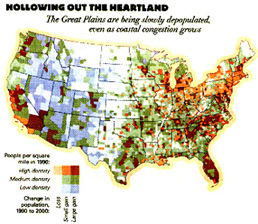
density of population is increasing in some areas, |
|
 |
|
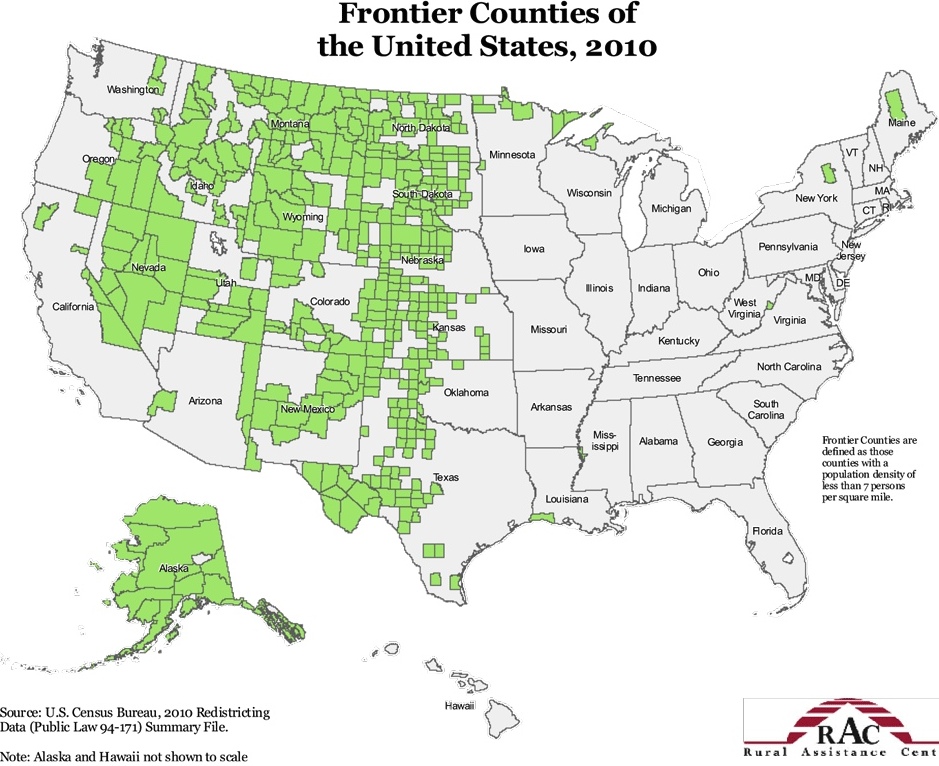
| The less populated areas are shown in green. | |
The great meridian | N.A. density | mapping coastal pollution | land-use | energy-use | utility pollution | solar | high hazard areas
The US in satellite composite photography
Click on the map for a larger view of land use patterns in the United States in the late 20th century.
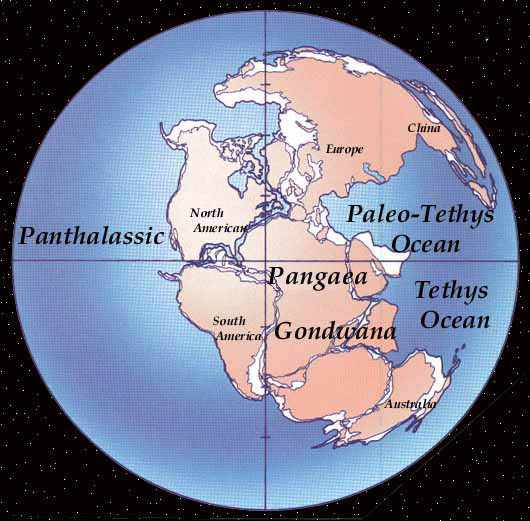
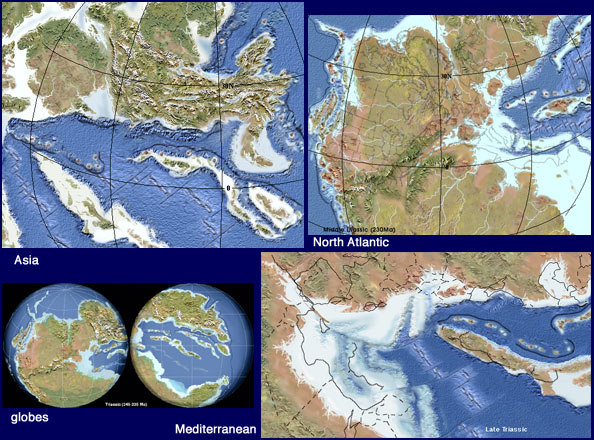
Geological Maps
What did the USA look like in geological times, specifically in the late Triassic?
The great meridian | N.A. density | mapping coastal pollution | land-use | energy-use | utility pollution | solar | high hazard areas
Forested areas reconstructed from a satellite maps.
The great meridian | N.A. density | mapping coastal pollution | land-use | energy-use | utility pollution | solar | high hazard areas
Maps allow us to visualize where we are, but to also imagine where important ecological and economic and commercial activities take place.
The United States is fortunate that a greater amount of our land surface is arable; that means able to grow crops and sustain livestock than most other nations on earth.
The great meridian | N.A. density | mapping coastal pollution | land-use | energy-use | utility pollution | solar | high hazard areas
The great meridian | N.A. density | mapping coastal pollution | land-use | energy-use | utility pollution | high hazard areas
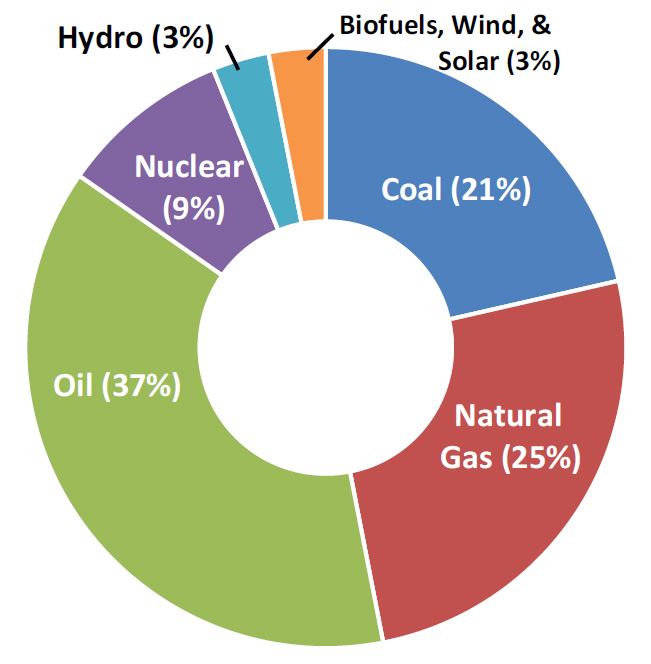
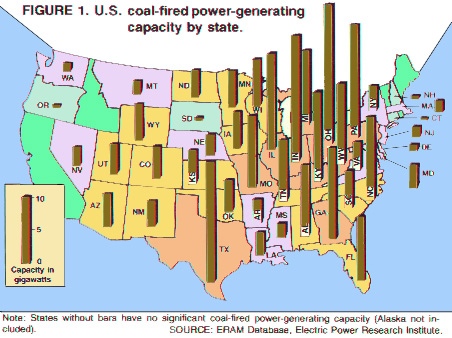
Schematic map of energy resources
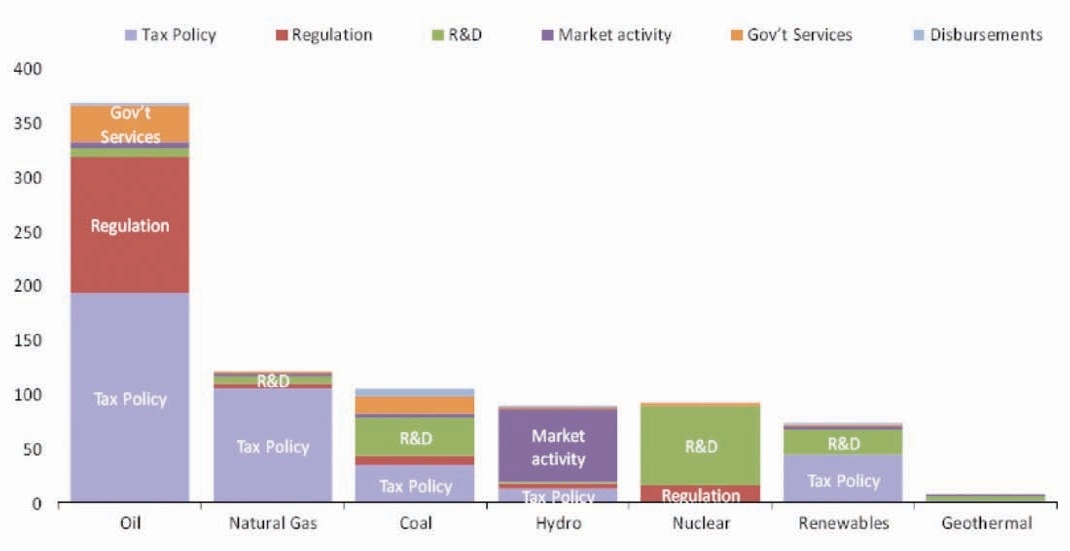
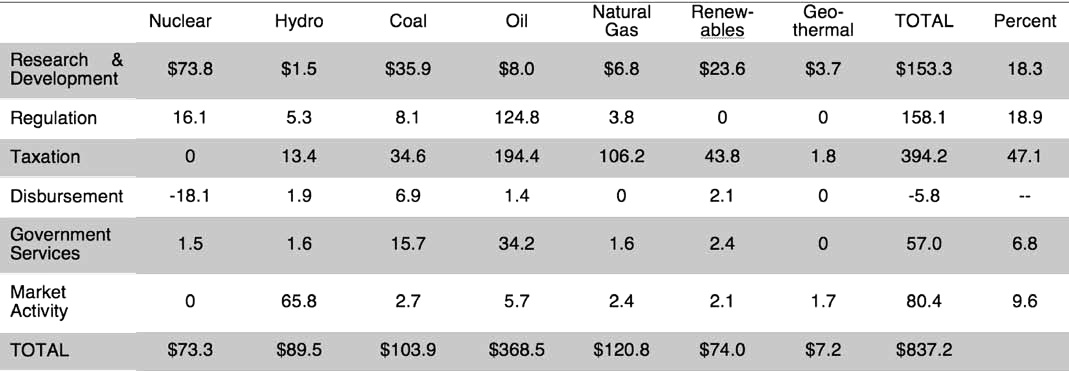
Energy subsidies displayed by sector.
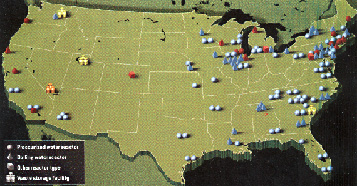
The nation's sources of fuel for transportation, electrical, and other energy use is depicted spatially by combining a map and bar graphs.
Where the Nuclear or atomic power plants are located.
Table of the Types of Energy subsidies.
The great meridian | N.A. density | mapping coastal pollution | land-use | energy-use | utility pollution | high hazard areas
With electricity comes pollution, air pollution from sulfur dioxide is a leading cause of acid rain.
The location of several outbreaks of hazardous algal blooms due to water pollution in the United States.
The great meridian | N.A. density | mapping coastal pollution | land-use | energy-use | utility pollution | solar | high hazard areas
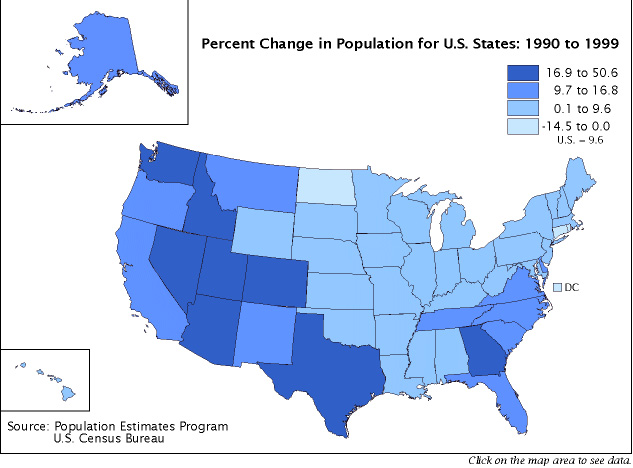
The size of a population is important but more revealing is the ages of the people, how long --on average-- they live and where the population is most densely concentrated.
Population migratory patterns
The great meridian | N.A. density | mapping coastal pollution | land-use | energy-use | utility pollution | solar | high hazard areas
The great meridian | N.A. density | mapping coastal pollution | land-use | energy-use | utility pollution | high hazard areas
The great meridian | N.A. density | mapping coastal pollution | land-use | energy-use | utility pollution | solar | high hazard areas
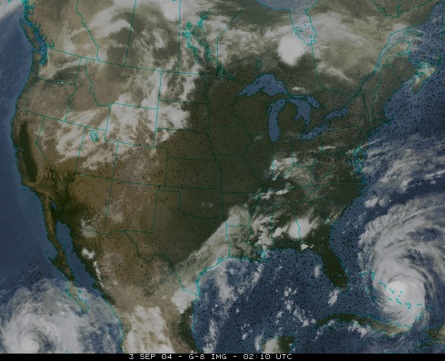
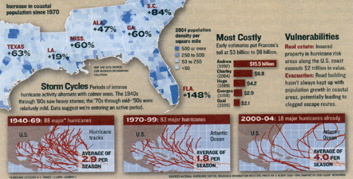
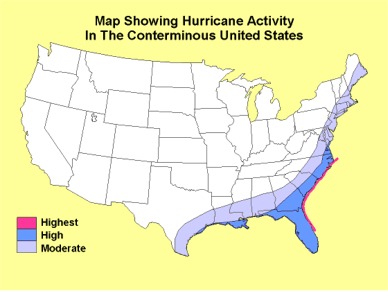
Hurricanes
The high hazard areas for costal residents:
Cyclonic storms and hurricane scope and sizes.
The great meridian | N.A. density | mapping coastal pollution | land-use | energy-use | utility pollution | solar | high hazard areas
Structural changes in the landscape
United State census data 1790-2010
The great meridian | N.A. density | mapping coastal pollution | land-use | energy-use | utility pollution | solar | high hazard areas