 Utility
 Utility
The value a consumer places on a unit of a good or service depends
on the pleasure or satisfaction he or she expects to derive form having or consuming
it at the point of making a consumption (consumer) choice.
In economics the satisfaction or pleasure consumers derive from the consumption
of consumer goods is called “utility”.
Consumers, however, cannot have every thing they wish to have. Consumers’
choices are constrained by their incomes.
Within the limits of their incomes, consumers make their consumption choices
by evaluating and comparing consumer goods with regard to their utilities.
Measuring utility in “utils” (Cardinal):
Jack derives 10 utils from having one slice of pizza but only
5 utils from having a burger.
In many introductory microeconomics textbooks this approach to measuring utility is still considered effective for teaching purposes.
Measuring utility by comparison (Ordinal):
Jill prefers a burger to a slice of pizza and a slice of pizza to a hotdog.
Often consumers are able to be more precise in expressing their
preferences.
For example, we could say:
Jill is willing to trade a burger with four hotdogs but she will give up only two hotdogs for a slice of pizza.
We can infer, with some degree of uncertainty, that to Jill, a burger has twice as much utility as a slice of pizza.
Utility and Money
Because we use money (rather than hotdogs!) in just about all of our trade transactions,
we might as well use it as our comparative measure of utility.
(Note: This
way of measuring utility is not much different from measuring utility in utils)
Jill could say: I am willing to pay $4 for a burger, $2 for a slice of pizza
and $1 for a hotdog.
Note: Even though Jill obviously values a burger more (four times as much) than
a hot dog, she may still choose to buy a hotdog even if she has enough money
to buy a
burger or a slice of pizza, for that matter.
Total Utility versus Marginal Utility
Marginal utility is the utility a consumer derives from the last unit of a consumer
good she or he consumes (during a given consumption period), ceteris paribus.
Total utility is the total utility a consumer derives from the consumption of
(all of the units) of a good over a given consumption period, ceteris paribus.
Total utility = Sum of marginal utilities
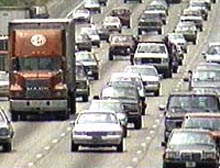
Can you have too much of a good thing?
[http://i.cnn.net/cnn/2002/TRAVEL/NEWS/06/20/traffic.jam/story.highway.traffic.jpg]
Check out the concept in economics
of:
The Law of Diminishing Marginal Utility
Over a given consumption period, the more of a good a consumer has, or has consumed,
the less marginal utility an additional unit contributes to his or her overall
satisfaction (total utility).
Alternatively, we could say: over a given consumption period, as more and more of a good is consumed by a consumer, beyond a certain point, the marginal utility of additional units begins to fall.
Total and Marginal Utility for Ice Cream (or
cars, or any of a range of perishable items)
http://www.oswego.edu/~atri/grpg11.gif
| Q |
($)TU | ($)MU |
| 0 |
0
|
|
| 1 |
40
|
40
|
| 2 |
85
|
45
|
| 3 |
120
|
35
|
| 4 |
140
|
20
|
| 5 |
150
|
10
|
| 6 |
157
|
7
|
| 7 |
160
|
3
|
| 8 |
160
|
0
|
| 9 |
155
|
-5
|
| 10 |
145
|
-10
|
|
145
|
Total Utility of Ice Cream
versus the
Marginal Utility of Ice Cream
www.oswego.edu/ ~atri/lecutilty.html
04/02/2005; 12:10 PM
More than ever, traffic jams waste time;
Los Angeles tops list for drivers getting stuck fuming.
www.cnn.com/2002/TRAVEL/ NEWS/06/20/traffic.jam/
COLLEGE STATION, Texas (CNN):
Traffic jams in the United States are costing Americans $68 billion
each year in wasted time and fuel, according to a new report.
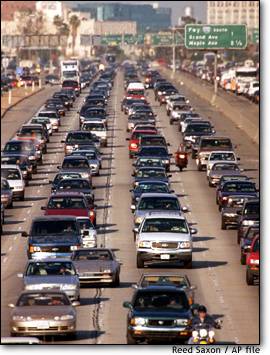
Based on the analysis of 75 U.S. cities, the annual Urban Mobility Report from
the Texas Transportation Institute finds the average rush-hour driver -- not just
commuters, but all drivers -- wastes about 62 hours in traffic each year.
That's not total travel time, that's just the extra time spent going slow or going nowhere because of traffic congestion. By several measures, the report found Los Angeles had the worst traffic. The report stated that the average Los Angeles rush-hour driver wasted 136 hours a year in slow or stopped traffic.
The runner-up metro areas in this time-draining category: San
Francisco, California; Washington; Seattle, Washington; Houston, Texas; San Jose, California; Dallas, Texas; New York; Atlanta, Georgia; and Miami, Florida.
The report also measured cities according to a Travel Time Index , which looked at how much slower a particular trip takes during rush hour compared with the same trip driven when traffic is flowing freely.
Los Angeles topped that list, too. The study said a rush hour trip in Los Angeles takes an average 90 percent longer than the same trip during a non-rush hour period. The runner-up metro areas in this category: San Francisco, California; Chicago; Washington; Seattle, Washington; Miami, Florida; Boston, Massachusetts; San Jose, California; Denver, Colorado; and New York.
The study also found that rush hours are lasting longer. In 1982, the report found traffic was congested about 4.5 hours a day for the 75 cities studied. In 2000, traffic was congested an average of seven hours a day. "All of this demand can't be handled in the (rush) hour like it used to be, so traffic spills over, trails over into other hours," said Tim Lomax, one of the report's lead authors.
 "And that's spreading to more of the urbanized areas, so
instead of just the area in the beltway being congested, it's a lot more than
that now." Lomax said roads and alternatives like public transportation
and telecommuting aren't keeping pace with the increased number of miles people
are driving, which is causing the congestion. In the average U.S. city, people
traveled 85 percent more miles by car in the year 2000 than they did in 1982.
"And that's spreading to more of the urbanized areas, so
instead of just the area in the beltway being congested, it's a lot more than
that now." Lomax said roads and alternatives like public transportation
and telecommuting aren't keeping pace with the increased number of miles people
are driving, which is causing the congestion. In the average U.S. city, people
traveled 85 percent more miles by car in the year 2000 than they did in 1982.
"There's a combination of factors -- the amount of people, the amount of
roadway that is there," Lomax said. "It's sort of a supply demand
relationship -- you can think of it that way. And there's a lot more demand
than there is supply."
