
Source: United Nations Development Programme, Human Development Report 2001: Making New Technologies Work for Human Development, New York: Oxford University Press, 2001, 10.

Comparative Economic Growth
Comparative Economic Data
Sources: World Bank, World Development
Report, 2002; IMF, World Economic Outlook, 1997
| Region or Country |
1979-1989 |
1990-2000 |
|
1999 |
PPP/2000 |
| East Asia |
|
|
|
|
|
| Central Asia |
|
|
|
|
|
| Latin America |
|
|
|
|
|
| ME/Nth. Africa |
|
|
|
|
|
| South Asia |
|
|
|
|
|
| Sub-Sah Africa |
|
|
|
|
|
| Malaysia |
|
|
|
|
|
| Singapore |
|
|
|
|
|
| Thailand |
|
|
|
|
|
Source: United Nations Development Programme, Human Development Report 2001: Making New Technologies Work for Human Development, New York: Oxford University Press, 2001, 10.
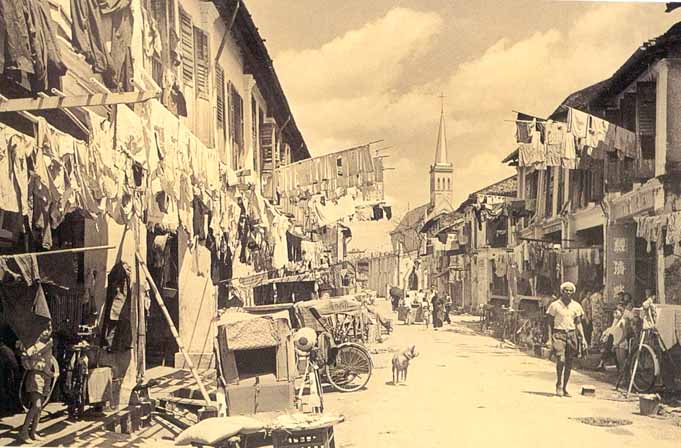
Economic Development in Singapore
1. Singapore in 1958 is a city of gangs, slums and marshes
Squatters' village in Bendemeer about 1957

Queen Street about 1960
2. Strategy of working with Malaysia fails in 1965 - generates
crisis
3. Singapore in 1958 has a significant communist presence, radical
unions, little manufacturing, few entrepreneurs, per capita income
of $500
4. Develop a strategy of attracting foreign investment (1961-1968)
5. Learn that TNCs move in groups - based on following each other
6. Firms in one nation tend to emulate each other more than those
in other nations (U.S. semiconductor firms and HDD firms)
7. Attracting one firm that succeeds will bring others
8. Establish infrastructure: electricity, shipping, airport, roads,
living facilities, spitting
9. Creation of economic development agency - Economic Development
Board - EDB (1961)
a) Steering, catalytic role
b) Organization and integration of government actions
c) Recruitment of TNCs
d) Envision future - observe market trends and develop market strategies for Singapore
e) Direct spending
10. TNCs will export based on free trade; reject import
substitution
11. Massive system of capital accumulation by the state - Central
Provident Fund is based on forced savings
12. Massive investment in infrastructure, housing, and education
financed by forced savings
13. State control over wages and labor rights - real wages growth
small until 1978; between 1978-1990, real wages double
14. Singapore workers were roughly as productive as those in the
US but in the 1960s Singapore wages were about 9% of those in
the US
15. Full employment was reached in the 1970s
16. Economic growth comes with low inflation, which helps to encourage
savings
17. Creation of significant SOEs in shipping, airline, banking,
and international trade - these firms were profit-oriented
18. The combination of infrastructure, low wages/high productivity/
and state support shaped market forces in Singapore and its relation
to global markets
19. Singapore leaders saw the importance of free trade AND were
ready to managed and control markets to their advantage
20. Large pool of capital attracts transnational financial service
firms - services are about as important as manufacturing.
21. Manufacturing TNCs begin to arrive in the late 1960s: Texas
Instruments and National Semiconductor
22. 1992: TNCs have 75% of manufacturing and 85% of exports
23. Singapore shifts to a technological development strategy between
1985-1990
24. Use of SOEs in many services areas: shipping, airlines, telecommunications
25. By the late 1960s, Singapore's leaders understood the significance
of globalization and developed a strategy for development based
on it
26. Singapore's success has one big lesson for developing nations:
the internal economy must be controlled so as to make it able
to benefit from free trade and free capital flows. Those benefits
must then be captured by local firms and institutions and used
to sustain economic development.