
Oil is to economic activity in the last 100 years what steam was to the 19th century.
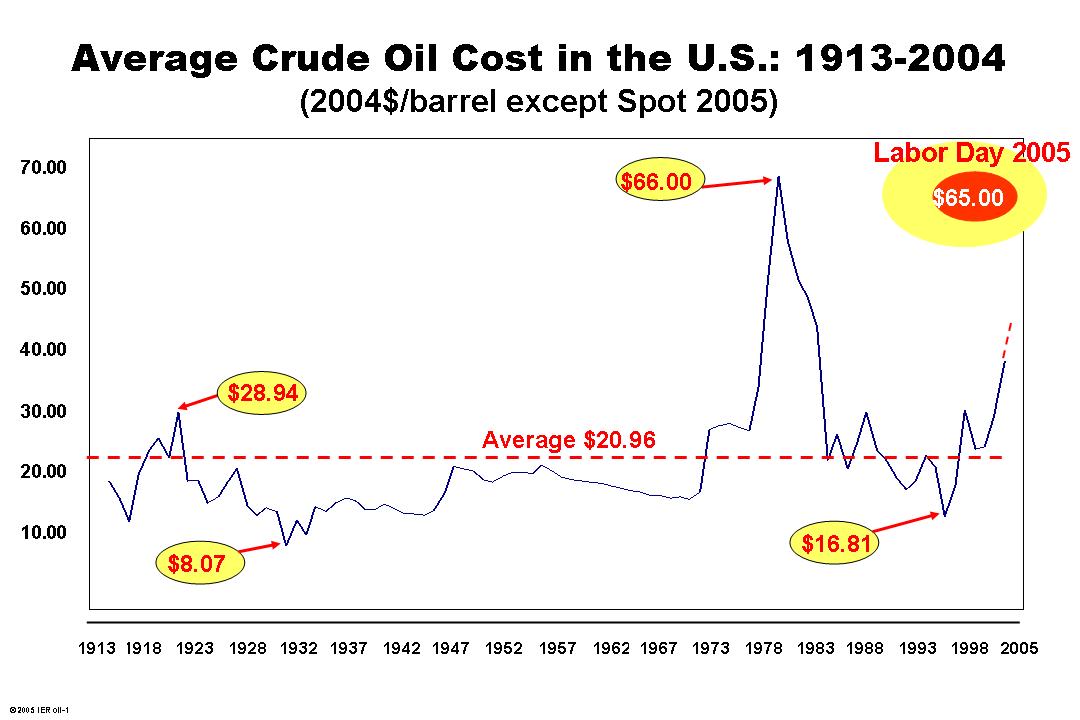
| year | Cost per barrel | |
|
| 1919 | $28.94 | ||
| 1930 | $8.07 | ||
| 1978 | $66.00 | ||
| 1995 | $16.81 | ||
| 2005 | $65.00 | ||
| 2006 | $70.00 | ||
| 1913-2006 | $20.96 | average cost | |
| 1989 on | |||
| 2008 | $91.48 | oil prices peaked at $145.85 then plunged to $32 | |
| 2009 | $53.48 | oil fell to near $35 a barrel in winter. | |
| 2010 | $71.21 | ||
| 2011 | $87.04 | ||
| 2012 | $86.46 | ||
| 2015 | $45.54 | Oct. 1, 2015 [1] | |
| U.S. Energy office has slightly higher figures | |||
![]()
![]()
![]()
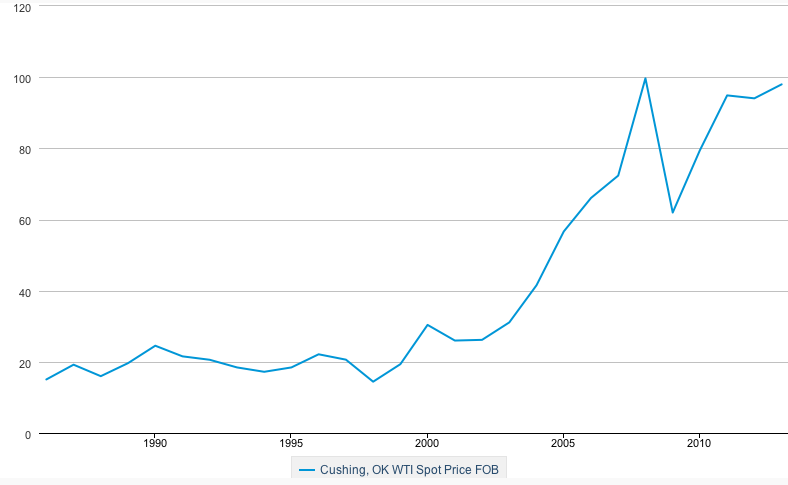
United States, Oklahoma based Oil prices 1985-2013
![]()
[1] Bloomberg Busines: "News: Energy & Oil" http://www.bloomberg.com/energy
[2] USEIA, United States Energy Information Administration: "Petroleum & other Liquids."
[3] WTRG's Energy Economist Newsletter.
"Oil Price History and Analysis"
"A discussion of crude oil prices, the relationship between prices and rig count and the outlook for the future of the petroleum"
WTRG Economics Copyright 1996-2011 by James L. Williams, wtrg@wtrg.com