Isotope Ratio mass spectrometry
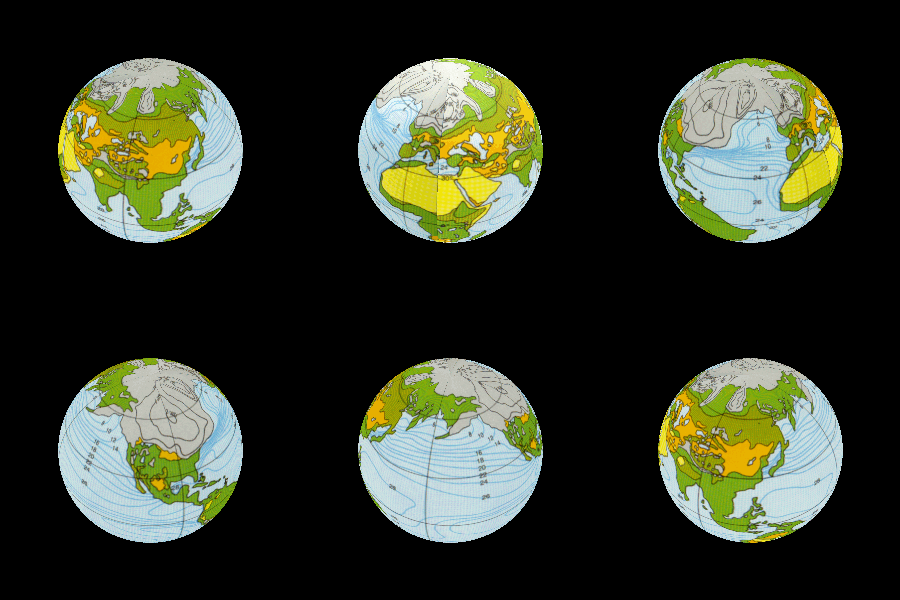
"Impacts of recent climate change have now been documented in all major regions of the world and in many natural and human systems. . . . Responses to climate variability, for example harvest failure due to drought, are often more easily detected than responses to gradual changes in climate . . . . The main messages of the assessment: The fact that impacts of climate change occur worldwide, and the urgency of addressing climate change." 1
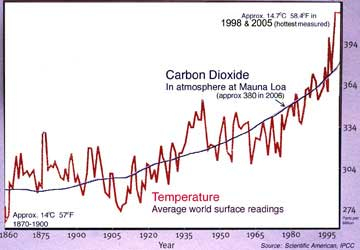
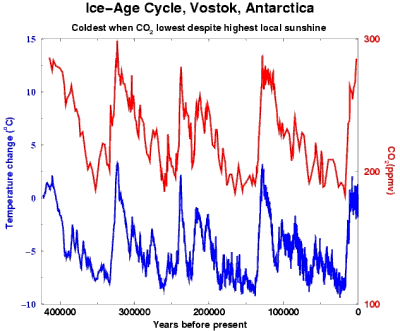
400 millennia of
CO2 & heat.
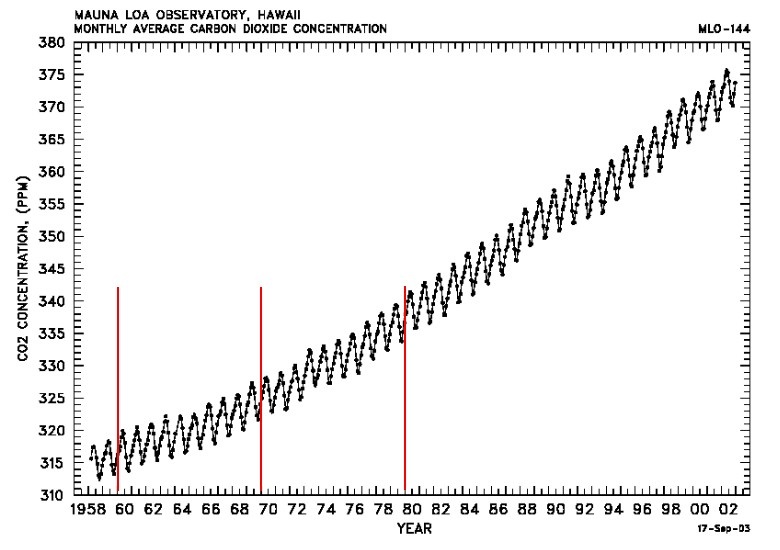
394.45 ppm
March, 2012
400.76 ppm
March 15, 2015
403.42 ppm
April 5, 2015
"Owing mainly to anthropogenic activities including land use change and fossil fuel burning, the 13C/12C [carbon isotopes] ratio of CO2 in the atmosphere has changed over the last 200 years by 1.5 parts per thousand."
p. 1 . 2
Annual CO2 increases compiled from Monthly Average Mauna Loa CO2 levels.
"Plant photosynthesis discriminates against carbon 13 isotopes. In other words, plant carbon tends to to have less 13C than the CO2 from which it is formed."
p. 2.
"A precise determination of the isotopic composition can help separate CO2 fluxes into terrestrial and marine components."
p. 13.
"...current fossil fuel emissions of about 6.1 Gt [gigatons] C [carbon] per year result in a long term change in the CO2 mixing ratio in the atmosphere of about 1.5 ppm per year. The carbon 13 isotope of CO2 changes about 0.02% per year."
p. 15.
"While it has been possible for the past 50 years to measure the CO2 mixing ratio and the isotopic composition of air samples directly, this information must be recovered by more indirect means for the more distant past. Much of our quantitative knowledge of climate fluctuation in the past has been derived from records preserved in the ice sheets, and deep sea sediments."
p. 16.
"It represents one of the earliest results from ice cores exhibiting a general increase in CO2 concentrations with time since 1750 together with a decrease in carbon 13 isotope values. Using these data it was possible to directly compare measurements of CO2 concentrations in air obtained from Mauna Loa since 1958 by Keeling et al. with longer term ice core archive record from Antarctica. The average carbon 13 isotope value of samples before 1800 A.D. is –6.41% in the ice core."
p. 16.
Prosenjit Ghosh, Willi A. Brand, "Stable isotope ratio mass spectrometry in global climate research,"
Why global warming is not a natural trend.
"Another, quite independent way that we know that fossil fuel burning and land clearing specifically are responsible for the increase in CO2 in the last 150 years is through the measurement of carbon isotopes.
Isotopes are simply different atoms with the same chemical behavior (isotope means “same type”) but with different masses.
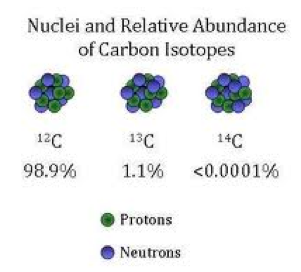
Atomic Nuclei and electron shells depicted.
Carbon is composed of three different isotopes, 14C, 13C and 12C. 12C is the most common. 13C is about 1% of the total. 14C accounts for only about 1 in 1 trillion carbon atoms.
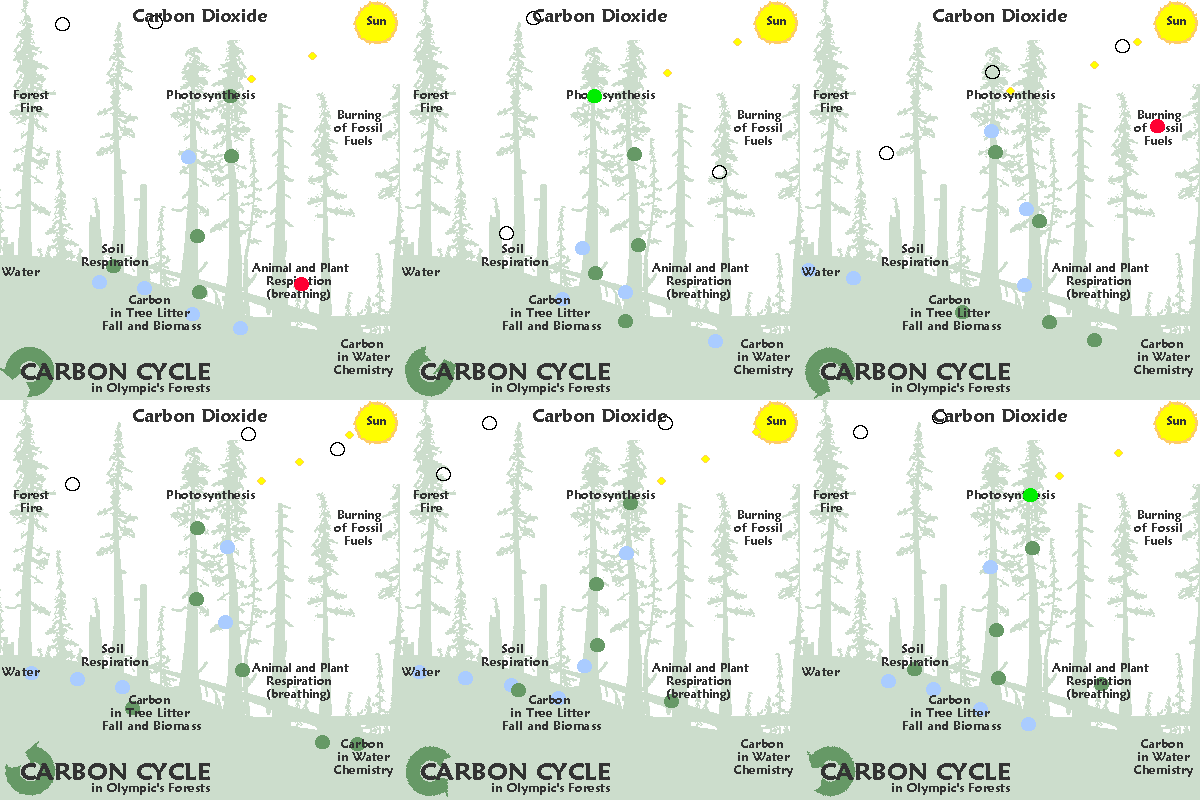
CO2 produced from burning fossil fuels or burning forests has quite a different isotopic composition from CO2 in the atmosphere. This is because plants have a preference for the lighter isotopes (12C vs. 13C); thus they have lower 13C/12C ratios.
Since fossil fuels are ultimately derived from ancient plants, plants and fossil fuels all have roughly the same 13C/12C ratio – about 2% lower than that of the atmosphere.
As CO2 from these materials is released into, and mixes with, the atmosphere, the average 13C/12C ratio of the atmosphere decreases.Furthermore, the 13 C / 12 C ratios begin to decline dramatically just as the CO2 starts to increase — around 1850 AD.
• This is exactly what we expect if the increased CO2 is in fact due to fossil fuel burning.
Furthermore, we can trace the absorption of CO2 into the ocean by measuring the 13 C / 12 C ratio of surface ocean waters.
√ While the data are not as complete as the tree ring data (we have only been making these measurements for a few decades) we observe what is expected: the surface ocean 13C/12C is decreasing.
√ Measurements of 13C/12C on corals and sponges — whose carbonate shells reflect the ocean chemistry just as tree rings record the atmospheric chemistry — show that this decline began about the same time as in the atmosphere; that is, when human CO2 production began to accelerate in earnest."
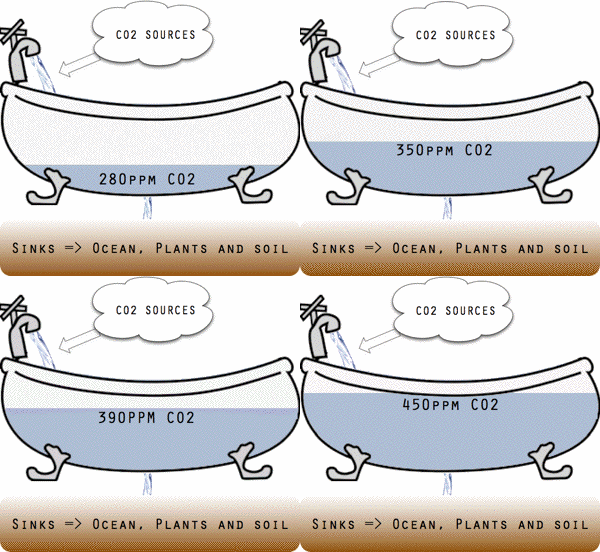
Threshold conceptually illustrated as a bathtub.
Isotopes can't lie; these heavy istopes are evidence of human interference
1 Gerrit Hansen & Wolfgang Cramer, "Global distribution of observed climate change impacts." Nature Climate Change. 5:3 March 2015. pp. 182-185.
2 Prosenjit Ghosh, Willi A. Brand, "Stable isotope ratio mass spectrometry in global climate research," International Journal of Mass Spectrometry, 228 (2003)pp. 1-33.
