 Total Consumer Spending from year to year on fuels at the Federal Level.
Total Consumer Spending from year to year on fuels at the Federal Level.
Federal tax subsidies to energy fuels in 2006 amount to a set of serial, perverse incentives. This means that there are –in addition to subsidies– the habits of underwriting costs of water use, and the investment of state and local funds to augment transport of raw and refined products of coal, oil, natural gas and nuclear fuels and waste materials, not to mention long-term storage costs and consequences of mining, water contamination and air pollution. The carbon emissions as a byproduct of these fuels are also not quantified in these tables.
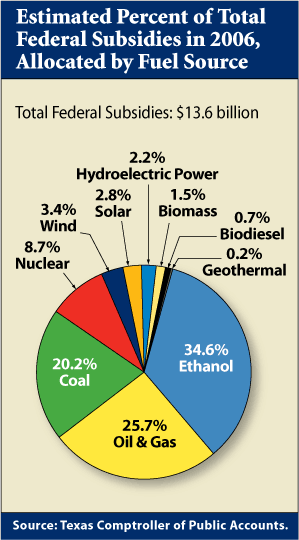
The State of Texas Comptroller’s office estimates that the total amount of federal energy subsidies for 2006 was $13.6 billion. Ethanol had the largest share, at $4.7 billion, or 34.6 percent of total subsidies. The share of federal subsidies by fuel source is shown in Exhibit 28-5.
Estimated Federal Government Taxpayer Subsidies
as a Share of Total U.S. Consumer Spending in 2006*
| item | Energy Source
|
Taxpayer Subsidies | Total Energy: Consumer Spending | Combined Spending on each Source | Federal Taxpayer Subsidies as a % of combined Spending |
|---|---|---|---|---|---|
| 1. | Oil and Gas** |
$3,502,732,143 | $772,404,554,400 | $775,907,286,543 | 0.5% |
| 2. | Coal |
$2,754,908,000 | $37,228,867,200 | $39,983,775,200 | 6.9% |
| 3. | Nuclear |
$1,187,426,000 | $4,506,192,000 | $5,693,618,000 | 20.9% |
| ST | Subtotal Nonrenewable |
$7,445,066,143 | $814,139,613,600 | $821,584,679,743 | 0.9% |
| 4. | Ethanol |
$4,708,277,549 | $13,082,400,000 | $17,790,677,549 | 26.5% |
| 5. | Biodiesel |
$92,315,835 | $840,350,000 | $932,665,835 | 9.9% |
| 6. | Wind |
$457,924,289 | $3,502,105,629 | $3,960,029,918 | 11.6% |
| 7. | Solar |
$382,756,318 | $2,731,644,481 | $3,114,400,799 | 12.3% |
| 8. | Hydroelectric power |
$295,234,608 | $56,123,748,494 | $56,418,983,102 | 0.5% |
| 9. | Biomass |
$209,641,875 | $50,421,528,417 | $50,631,170,292 | 0.4% |
| 10. | Geothermal |
$29,158,534 | $5,825,057,818 | $5,854,216,352 0.5% | 0.5% |
st |
Subtotal Renewables | $6,175,309,008 | $132,526,834,839 | $138,702,143,847 | 4.5% |
| T | Total Subsidies | $13,620,375,151 | $946,666,448,439 | $960,286,823,590 | 1.4% |
| $13.6 billion | .946 Trillion dollars spent. | This is a skewed percentage*, |
|||
Exhibit 28-6: Texas State Study, 2007.
One way to evaluate the amount of governmental subsidies is to compare them to the national total of consumer spending for each source of fuel. Exhibit 28-6, above, shows federal subsidies for 2006 as compared to national level spending for each fuel source. But this not include highway expenditures, gasoline taxes, water price supports, and local tax subsidies for refineries.
Christian Science Monitor in 2011 reported for example $8 billion alone in coal subsides "or about 10 percent of total federal largess."
"Budget hawks: Does US need to give gas and oil companies $41 billion a year?", By Mark Clayton, Staff writer / March 9, 2011.
![]()
willingness | market | polls | economics | recovery