| Percent | % Arable land from the World Bank estimates | 2011 | sq. kilometers | per sq. Kilometers | World Bank data | Carbon Dioxide | GNI/PPP US | % | modern | Comment | Comment | Gross area in | |||||||
| Rank 2012 | Nations | 2003-07 | 2008-12 | population | TFR | IMR | Area | Density | GNI / capita | life expectancy | metric tons / capita | Urban | contraceptive | NC-disease | rank-in-extent | Arable land K.sq | Nations | ||
| Source: WB-Ur | 1 | Uruguay | 85.1 | 84.6 | 3.4 | 2 | 10.6 | 176,220 | 19 | $11,860.00 | 76 | 2.4 | $12,900.00 | 93% | 75 | 149,082.1 | Uruguay | ||
| Source: WB-B | 2 | Burundi | 85.3 | 83.7 | 10.2 | 6.4 | 66 | 27,830 | 367 | $250.00 | 50 | 0 | $390.00 | 11% | 18 | 23,293.7 | Burundi | ||
| Source: WB-Com | 3 | Comoros | 80.6 | 83.3 | 0.8 | 4.8 | 65 | 2,170 | 337 | $770.00 | 61 | 0.2 | $1,180.00 | 28% | 19 | 1,807.6 | Comoros | ||
| Source: WB-N | 4 | Nigeria | 85.1 | 81.8 | 162.3 | 5.7 | 89 | 923,768 | 176 | $1,280.00 | 52 | 0.5 | $2,070.00 | 51% | 8 | 10 | 755,642.2 | Nigeria | |
| Source: WB-SA | 5 | South Africa | 81.8 | 81.7 | 50.5 | 2.4 | 48 | 1,219,912 | 69 | $6,960.00 | 52 | 10.1 | $10,050.00 | 62% | 60 | 9 | 996,668.1 | South Africa | |
| Source: WB-RW | 6 | Rwanda | 81.1 | 81.1 | 10.9 | 4.6 | 50 | 26,338 | 415 | $570.00 | 55 | 0.1 | $1,130.00 | 19% | 45 | 21,360.1 | Rwanda | ||
| Source: WB-SA | 7 | Saudi Arabia | 80.7 | 80.7 | 27.9 | 2.9 | 18 | 1,960,582 | 13 | $17,820.00 | 74 | 16.1 | $24,020.00 | 81% | 24 | 7 | 1,582,189.7 | Saudi Arabia | |
| Source: WB-KAZ | 8 | Kazakhstan | 77 | 77.2 | 16.6 | 2.7 | 18 | 2,217,300 | 6 | $8,260.00 | 68 | 14 | $10,320.00 | 54% | 49 | 6 | 1,711,755.6 | Kazakhstan | |
| Source: WB-LESO | 9 | Lesotho | 77.8 | 77 | 2.2 | 3.1 | 91 | 30,355 | 72 | $1,220.00 | 48 | 0 | $1,800.00 | 23% | 46 | 23,373.4 | Lesotho | ||
| Source: WB-SAR | 10 | Syrian Arab Republic | 75.7 | 75.7 | 22.5 | 3.2 | 17 | 185,180 | 122 | $2,750.00 | 76 | 3.3 | $4,620.00 | 54% | 43 | 140,181.3 | Syrian Arab Republic | ||
| Source: WB-MOD | 11 | Moldova | 75.4 | 75.2 | 4.1 | 1.3 | 12 | 33,843 | 121 | $1,980.00 | 69 | 1.3 | $3,010.00 | 42% | 43 | 25,449.9 | Moldova | ||
| Source: WB-MON | 12 | Mongolia | 74.6 | 74.5 | 2.8 | 2.6 | 39 | 1,565,000 | 2 | $2,310.00 | 68 | 5.3 | $3,330.00 | 61% | 61 | 8 | 1,165,925.0 | Mongolia | |
| Source: WB-UK | 13 | United Kingdom | 73.1 | 71.6 | 62.7 | 2 | 4.5 | 244,820 | 258 | $37,840.00 | 80 | 7.7 | $35,860.00 | 80% | 84 | OECD | 175,291.1 | United Kingdom | |
| Source: WB-UKR | 14 | Ukraine | 71.3 | 71.2 | 45.7 | 1.4 | 9.1 | 603,700 | 76 | $3,130.00 | 70 | 5.9 | $6,180.00 | 69% | 48 | 13 | 429,834.4 | Ukraine | |
| Source: WB-BAN | 15 | Bangladesh | 69 | 70.3 | 150.7 | 2.4 | 45 | 144,000 | 1046 | $780.00 | 69 | 0.3 | $1,150.00 | 25% | 52 | 101,232.0 | Bangladesh | ||
| Source: WB-MAD | 16 | Madagascar | 70.2 | 70.2 | 21.3 | 4.6 | 42 | 587,040 | 36 | $430.00 | 67 | 0.1 | $990.00 | 31% | 28 | 14 | 412,102.1 | Madagascar | |
| Source: WB-MOR | 17 | Morocco | 67.2 | 67.3 | 32.3 | 2.2 | 30 | 446,550 | 72 | $2,970.00 | 72 | 1.5 | $4,400.00 | 56% | 52 | 15 | 300,528.2 | Morocco | |
| Source: WB-LEB | 18 | Lebanon | 67.2 | 67.3 | 4.3 | 2.1 | 21 | 10,400 | 410 | $9,140.00 | 73 | 5 | $13,400.00 | 87% | 34 | 6,999.2 | Lebanon | ||
| Source: WB-HA | 19 | Haiti | 64.2 | 66.8 | 10.1 | 3.4 | 59 | 27,750 | 365 | $700.00 | 62 | 0.2 | 53% | 24 | 18,537.0 | Haiti | |||
| Source: WB-HUN | 20 | Hungary | 64.6 | 63.9 | 10 | 0.9 | 5.3 | 93,030 | 107 | $12,730.00 | 74 | 4.9 | $19,090.00 | 68% | 71 | > OECD | 59,446.2 | Hungary | |
| Source: WB-MOZ | 21 | Mozambique | 62.4 | 62.7 | 23.1 | 4.6 | 86 | 801,590 | 29 | $470.00 | 50 | 0.1 | $880.00 | 31% | 11 | 11 | 502,596.9 | Mozambique | |
| averages | 74.66 | 674.40 | 3.11 | 39.31 | 11,327,378 | 196.10 | $5,915.24 | 65.05 | 3.76 | $7,838.50 | 65.05 | 42.6 | of the world' | 10% | averages | ||||
| Source: WB-MI | *14 | Marshall Islands | 72.2 | 72.2 | 0.1 | 4.3 | 21 | 181 | 304 | $3,910.00 | 65 | 1.9 | 68% | 42 | 130.7 | Marshall Islands | |||
| population | Std. deviatio | 44.7 | kilometers square | ||||||||||||||||
| World | World average | 2.4 | 41 | 52 | 70 | $10,760.00 | 51% | 56 | 0.63 | ||||||||||
| Other nations | rank | (largest populations) | Arable land as percent | population | fertility | Infant | area | density | GNI | life expectancy | carbon emissions | GNO / PPP | urban | Contracept | N/C disease | Rank-in-extent | in 2012 | ||
| Source: WB-Ch | 1 | China | 56 | 56.2 | 1345.9 | 1.5 | 17 | 9,596,960 | 36 | $4,940.00 | 73 | 5.8 | $6,890.00 | 50% | 1 | 5,393,491.52 | China | ||
| Source: WB-USA | 3 | United States * | 44.2 | 44.1 | 311.7 | 2 | 6.1 | 9,629,091 | 32 | $48,620.00 | 78 | 17.3 | $45,640.00 | 79% | 2 | 4,246,429.13 | United States * | ||
| Source: WB-INDO | 4 | Indonesia | 28.7 | 29.6 | 238.2 | 2.3 | 30 | 1,919,440 | 125 | $2,940.00 | 69 | 1.9 | $3,720.00 | 43% | 11 | 568,154.24 | Indonesia | ||
| Source: WB-BRAZ | 5 | Brazil | 31.3 | 31.3 | 196.7 | 1.9 | 20 | 8,511,965 | 23 | $10,720.00 | 73 | 1.9 | $10,160.00 | 87% | 3 | 2,664,245.05 | Brazil | ||
| Source: WB-INDIA | 2 | India | 60.4 | 60.5 | 1241.3 | 2.6 | 50 | 3,287,590 | 378 | $1,410.00 | 65 | 1.6 | $3,280.00 | 29% | 5 | 1,988,991.95 | India | ||
| 8 | Bangladesh | 69 | 70.3 | 150.7 | 2.4 | 45 | 144,000 | 1046 | $780.00 | 69 | 0.3 | $1,150.00 | 25% | 101,232.00 | Bangladesh | ||||
| Source: WB-PAK | 6 | Pakistan | 34.1 | 34.1 | 176.9 | 3.6 | 64 | 803,940 | 222 | $1,120.00 | 65 | 0.9 | $2,680.00 | 35% | 16 | 274,143.54 | Pakistan | ||
| Indian sub-continent sub-totals: | 54.97 | 1568.9 | 2.87 | 53.00 | 4,235,530 | 548.67 | $1,103.33 | 66.33 | 0.93 | 2370.00 | 30% | 2,364,367.49 | Indian sub-continent | ||||||
| Kilometers Sq | |||||||||||||||||||
| Ã | Special hot spots | 2003-07 | 2008-12 | population | TFR | IMR | Area | Density | Wbank GNI | life expectancy | Metric tons CO2/per | GNI PPP | Urban | ||||||
| Source: WB-ISR | Israel | 23.8 | 24.1 | 7.9 | 3 | 3.6 | 20,770 | 355 | $28,930.00 | 82 | 9 | $27,010.00 | 92% | 5,006 | Israel | ||||
| Source: WB-GAZA | West Bank & Gaza | 61.1 | 61 | 4.2 | 4.6 | 25 | 6,220 | 692 | $1,250.00 | 73 | 0.6 | 83% | 3,794 | West Bank & Gaza | |||||
| Source:-Russia | Russian Federation | 13.2 | 13.2 | 143.2 | 1.6 | 7.5 | 17,075,200 | 8 | $10,730.00 | 69 | 11.1 | $19,240.00 | 74% | 65 | 82 | 4 | 2,253,926 | Russian Federation | |
| Source: WB-Neth | Netherlands | 57.1 | 56.8 | 16.7 | 1.8 | 3.8 | 41,526 | 402 | $49,650.00 | 81 | 10.3 | $39,740.00 | 66% | 23,587 | Netherlands | ||||
| Sources by columns: | square kilometers | ||||||||||||||||||
| D & E | http://data.worldbank.org/indicator/AG.LND.AGRI.ZS | Population | |||||||||||||||||
| millions | |||||||||||||||||||
| G-H | World population data sheet for 2011 | ||||||||||||||||||
| N-O | World population data sheet for 2011 | ||||||||||||||||||
| A | World Bank data pages 2011 | ||||||||||||||||||
| K-L-M | http://data.worldbank.org/countr | 2011 | |||||||||||||||||
| Area–'I' | http://www.mongabay.com/igapo/world_statistics_by_area.htm | ||||||||||||||||||
|
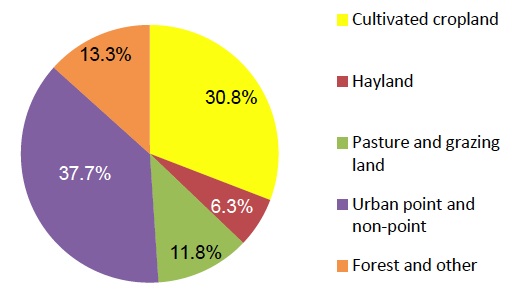
The Arable land (% of land area) in the United States was 45 per cent in 2009, according to a World Bank report, published in 2010. |
|||||||||||||||||||
Arable land includes land defined by the FAO as land under temporary crops (double-cropped areas are counted once), |
|||||||||||||||||||
and land temporarily fallow. Land abandoned as a result of shifting cultivation is excluded. Agricultural land (% of land area)
|
|||||||||||||||||||
| 1.047% is Mumbai's percentage of India's population | |||||||||||||||||||


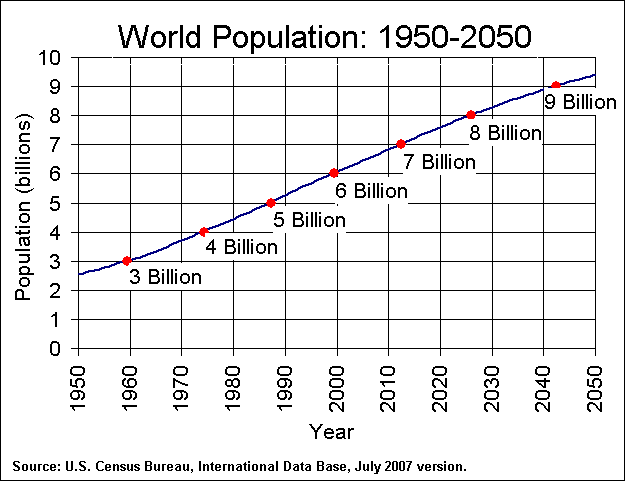
Population of the world | Malthus | US population