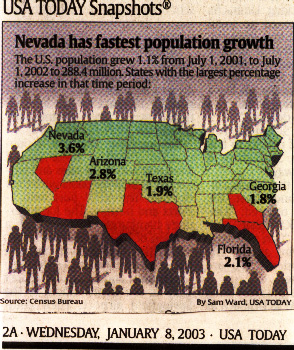
Population Growth: by decade from 1790 - 2000
|
Census |
Population |
density |
% urban |
Conflicts | |
|
date
|
amount
|
square mile
|
rural
|
city
|
|
|
1790 |
3,929,214 |
4.5 |
5.1 |
||
|
1800 |
5,308,483 |
6.1 |
6.1 |
||
|
1810 |
7,239,881 |
4.3 |
7.2 |
war of 1812 | |
|
1820 |
9,638,453 |
5.5 |
7.2 |
||
|
1830 |
12,866,020 |
7.3 |
8.8 |
||
|
1840 |
17,069,453 |
9.7 |
10.8 |
Mexican War | |
|
1850 |
23,191,876 |
7.9 |
15.3 |
||
|
1860 |
31,433,321 |
10.6 |
19.8 |
civil war | |
|
1870 |
39,818,449 |
13.4 |
24.9 |
||
|
1880 |
50,155,783 |
16.9 |
28.2 |
||
|
1890 |
62,947,714 |
21.2 |
35.1 |
||
|
1900 |
75,994,575 |
25.6 |
39.7 |
||
|
1910 |
91,972,266 |
30.9 |
45.7 |
World War I | |
|
1920 |
105,710,620 |
35.5 |
51.2 |
||
|
1930 |
122,775,046 |
41.2 |
56.2 |
||
|
1940 |
131,669,275 |
44.2 |
56.5 |
World War II | |
|
1950 |
150,697,361 |
50.7 |
64.1 |
||
|
1960 |
179,323,175 |
50.6 |
69.9 |
Vietnam war | |
|
1970 |
203,235,298 |
57.5 |
73.5 |
||
|
1980 |
226,504,825 |
64.1 |
73.7 |
||
|
1990 |
248,718,000 |
70.3 |
74.9 |
1st Gulf War | |
|
2000 |
275,600,000 |
80.7 |
79.1 |
2nd Gulf War | |
|
2010
|
308,745,538
|
87.4
|
82.1
|
Afghan War
|
|
17 to 18 percent arable land area.
The World at Seven Billion, Wiki by J.V. Siry
Adam Rome, Bulldozer in the Countryside. (2001)

The shape of urban living in the postwar years
China's population history in comparison

