Chinese populations have changed dramatically over time.
Chinese populations have changed dramatically over time.
diagram | data chart | map
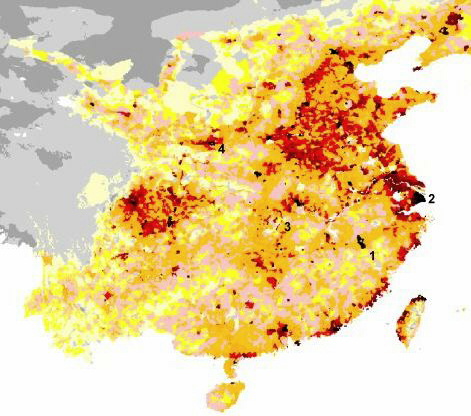
Shanghai, Wuhan, Chongqing and Xian are noted by red-dense patterns of population on the map.
| entry # | Chinese Population from 100 BCE to 2000 CE |
Graph | |||||||
| Year | population | CHANGE | % | North | Cent-south | Notes | Dynasty | ||
| 1 | -100 | 57 | Hwang-Ho | Yangtze | Early Han | ||||
| 2 | 220 | 57 | 0 | Late Han | |||||
| 3 | 600 | 45 | -12 | -21% | 35 | 10 | Sui | ||
| 4 | 750 | 45 | 0 | 0% | 25 | 20 | T'ang | ||
| 5 | 1080 | 78 | 33 | 73% | 33 | 45 | N. Sung | ||
| 6 | 1200 | 100 | 22 | 28% | 45 | 65 | S. Sung | ||
| 7 | 1250 | 110 | 10 | 10% | Chin | ||||
| 8 | 1350 | 60 | -50 | -45% | Yuan Mongol | ||||
| 9 | 1450 | 100 | 40 | 67% | Ming | ||||
| 10 | 1550 | 125 | 25 | 25% | |||||
| 11 | 1650 | 95 | -30 | -24% | Ch'ing | ||||
| 12 | 1740 | 200 | 105 | 111% | |||||
| 13 | 1800 | 300 | 100 | 50% | |||||
| 14 | 1875 | 420 | 120 | 40% | |||||
| 15 | 1969 | 740 | 320 | 76% | People's Rep | ||||
| 16 | 2005 | 1304 | 564 | 76% | 1.6 TFR | ||||
| 17 | 2011 | 1339 | 35 | ||||||
| 18 | 2025 | 1476 | 172 | 13% | estimated |
|
|||
The Long Road to over a billion people; one sixth of the Earth's people, a diagram:
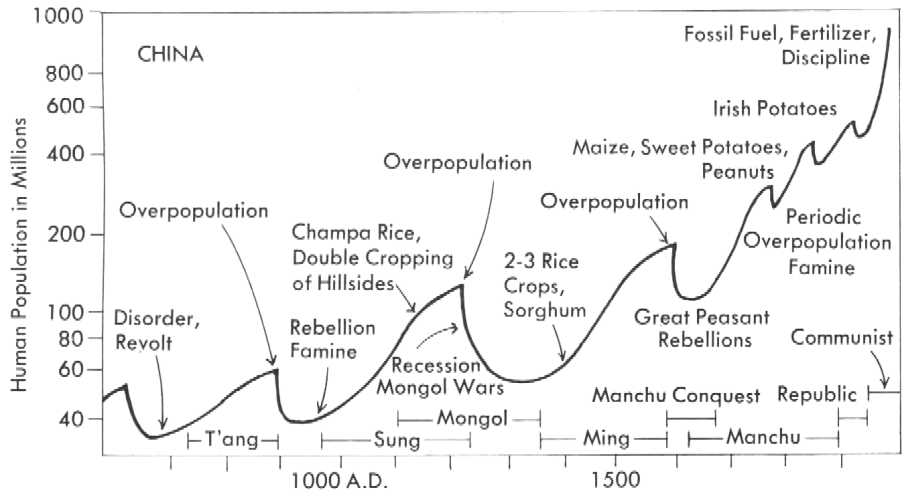
China's many recovery's and subsequent rise to power.
diagram | data chart | map
China technological origins | Technology | Ancient Science