 And around the world.
 And around the world.
“Income is the amount of money that comes into a household. . . .”
Stephen J. Rose
People on Food Stamps | World map of inequality | USA Income Pyramid | Income inequality selected nations
 “the world can’t survive half rich and half poor,”
Sir Charles Percy Lord Snow, (1959) p. 45.
“Wealth, on the other hand, is the total monetary value of what a household owns minus debts.”
Top 1% 26.8% of all wealth
Next 4% 21.4% of all wealth
Next 5% 9.7% of all wealth
57.9% of all wealth is held by the top decile or ten percent of the US population.
The income earned in a year by people is distributed in a less stratified manner as shown here:
“As you can see the distribution of wealth is much more unequal than the distribution of income.”
Page, 33. Social Stratification in the United States. 2008.
People on Food Stamps | World map of inequality | USA Income Pyramid | Income inequality selected nations
Global social stratification by countries,
Using the Gini coefficient grouped nations on income inequality to determine extremes of moderate to extreme income inequality. (2011)
Nations |
GINI Coefficient of inequality |
GNI per capita |
Physicians / 10,000 |
|
|---|---|---|---|---|
| Sweden | 23 | $ 44,760 | 38.7 | |
| Hungary | 24.7 | $ 21,000 | 34.1 | |
| United States | 45 | $ 53,960 | 24.2 | |
| South Africa | 65 | $ 12,240 | 7.6 | |
| Namibia | 70.7 | $ 9,590 | 3.7 |
Source Global Sociology Blog.
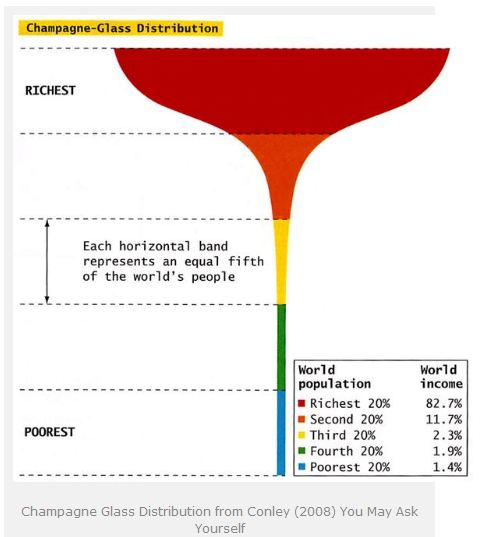
If we look at global incomes published in 2008, we see that there is a dramatic problem is income inequality. In a report done by the World Bank in 2008, almost half of the world, about 3 billion people, lived on less than $2.50 a day. 80% of the world's population lived on less than $10 a day.

Health and the consequences of income inequality.
People on Food Stamps | World map of inequality | USA Income Pyramid | Income inequality selected nations
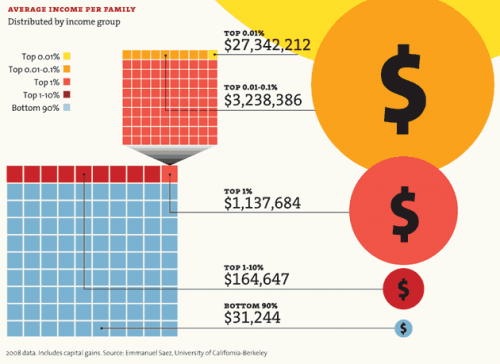
A larger share of the nation's economic growth over the past 30 years has gone to the top one-hundredth of one percent, who now make an average of $27 million per household. The average income for the bottom 90 percent of us? $31,244.

Map of counties where people in the United States are on food stamps.
Food insecurity map of the United States.
People on Food Stamps | World map of inequality | USA Income Pyramid | Income inequality selected nations
Facts on US farm worker population in Florida:

Facts and Figures on Florida Farmworkers
Council of Immokalee Farmworkers (is an NGO)
1) “A labor force in significant economic distress”: In January 2001, the U.S. Department of Labor (DOL) sent a letter to members of the United States Congress reporting on the stark realities facing agricultural workers. Entitled “The Agricultural Labor Market - Status and Recommendations,” the letter described farmworkers as “a labor force in significant economic distress.”
The report cited farmworkers’ “low wages, sub-poverty annual earnings, (and) significant periods of un- and underemployment” to support its conclusion, adding that “agricultural worker earnings and working conditions are either stagnant or in decline.”
Other findings from the DOL letter include:i
⇒ “Production of fruits and vegetables has increased and global demand for American produce continues to grow, but agricultural worker earnings and working conditions are either stagnant or in decline.”
⇒ “Farm workers not only lost ground relative to other workers in the private sector, they lost ground absolutely.”
⇒ “(E)exclusions from legal protections have a negative impact on farm workers and contribute to the factors that discourage farm workers from staying in the industry or others from seeking work in agriculture.”
2) Farmworkers earn poverty level wages:
The National Agricultural Workers Survey (NAWS) provides a periodic account of hired farmworker salaries and poverty level. ii
The study sample includes wages of managers and supervisors, who according to the USDA represent 21 percent of all hired farmworkers. This results in a very definite skewing upward of the NAWS figures.
Harvester-specific annual income figures would be significantly lower.
Nevertheless, the NAWS figures still show farmworkers earning at or below poverty level:
| Average Farm Worker Salary, NAWS 2005 | 2007 Federal Poverty Guidelines, HHS |
Living Wage for Immokalee, FL |
|
|---|---|---|---|
| Individual income | $10,000 – 12,499 | $10,210 | $18,486 |
| Household income | $15,000-17,499 | $20,650 (family of four) | $44, 993 (family of four) |
3) No right to overtime or to organize: As a result of intentional exclusion from key New Deal labor reform measures, including the National Labor Relations Act and the Fair Labor Standards Act, farmworkers do not have the right to overtime pay or the right to organize and collectively bargain with their employers.
4) Thirty years of stagnant piece rates in the tomato harvest: Tomato pickers often work 10-12 hour days.
People on Food Stamps | World map of inequality | USA Income Pyramid | Income inequality selected nations
decile – each of ten equal groups into which a population can be divided according to the distribution of values of a particular variable
Gini coefficient – is a measure of statistical dispersion that is used to create a Gini index to measure the extent to which the distribution of income or consumption expenditure among individuals or households within an economy deviates from a perfectly equal distribution such that G = A / (A + B).
A Lorenz curve plots the cumulative percentages of total income received against the cumulative number of recipients, starting with the poorest individual or household.
The Gini index measures the area between the Lorenz curve and a hypothetical line of absolute equality, expressed as a percentage of the maximum area under the line.
Thus a Gini index of 0 represents perfect equality, while an index of 100 implies perfect inequality.
Sources: CIW - Report
Rose & Livingston (1979-2006)
People on Food Stamps | World map of inequality | USA Income Pyramid | Income inequality selected nations