Earth station:
evidence | graphic data | interpreting the data | levels | Are altering Earth? | Implications | entropy | links
![]()
 Mauna Loa mountain top, Hawaiian Isles.
One of the seven graphs below displays a 44 year measurement of carbon dioxide. The accumulation of even trace amounts of carbon dioxide in the Earth's atmosphere and oceans is an example in science of how very small measures have very large consequences. Often trace elements control quite immense systems with long-term impacts from short-term fluctuations.
By interpreting such a large percent increase in those few years over the base year of 1958 is, as one can see, unprecedented in history, or even in any previous prehistoric periods.
2015 level of carbon dioxide in the atmosphere: November 18 was 400.4 part per million.
One, Two, Three, Four, Five, Six, Seven.
Film interpreting consequences of rapid rise.
 "relentless rise . . ."
This other film entitled "Trends in Atmospheric Carbon Dioxide" is displaying data based on ice-core analysis reveals that "the pace of change is accelerating," NPR reports.
1.36% average yearly increase over four decades,
is now closer to 3% per year. * U C San Diego
![]()
![]()
![]()
![]()
![]()
![]()
![]()
![]()
![]()
![]()
![]()
![]()
![]()
![]()
![]()
![]()
![]()
![]()
James Hansen on feedbacks and ice sheets melting on land.
∞
"The Truth About Climate Change," October 30, 2013. [first 1:010]
A documentary by Sir David Attenborough -
More recent decades show an annually increasing rate of accumulated carbon dioxide in the atmosphere.
Graph Two: gases rising in recent decades to the present.
Heat trapping vapor gas accumulation is not confined to carbon dioxide alone. Methane, nitrous oxide and Chlorofluorocarbons (CFCs) are also on the rise.
![]()
![]()
![]()
![]()
![]()
![]()
![]()
![]()
evidence | graphic data | interpreting the data | Implications
IPCC findings | earth change monitoring | long term monitoring | close to home | Graph Three | atmosphere
Evidence from the station keeper:
"The first monthly average carbon dioxide reading at Mauna Loa was 315.7 parts per million (ppm) in March 1958."
Charles David Keeling was awarded the National Medal of Science in a White House presentation on 13 June 2002 for his lifetime achievement in scientific research.
His significant studies of the carbon cycle and the increase of atmospheric CO2, have been a pivotal marker in the study of global climate change.
Keeling's scientific contributions have affected the scientific, economic and social challenges which confront us today and well into the future.
Keeling was the first to model the accumulation of atmospheric carbon dioxide.
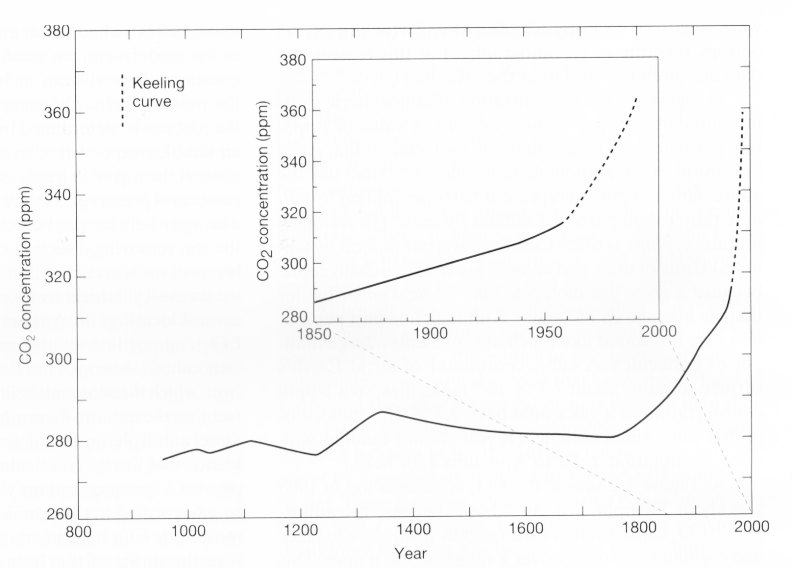
The "Keeling curve" (Figure above) encapsulates 45 years of time of series measurements of atmospheric carbon dioxide taken atop Mauna Loa, Hawaii.
His data confirmed that the increased accumulation of carbon dioxide produced by burning fossil fuels and other industrial products, contributed to the greenhouse effect. Under Keeling's work for the Joint Institute for Marine Observations –JIMO–, his research, which is a continuum of his lifetime study of the global carbon cycle, developed measurement techniques in analyzing Ar / N2 ratios [ the fractions of argon to nitrogen levels].
![]()
![]()
![]()
![]()
![]()
![]()
![]()
![]()
evidence | graphic data | interpreting the data | Graph Three | Implications
The "Keeling Curve" confirms a steady increase in carbon dioxide levels contributing to the greenhouse effect.
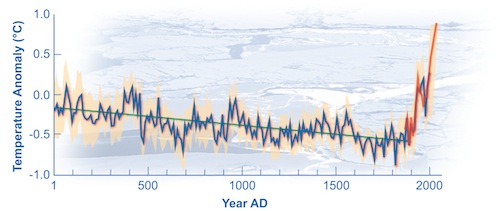
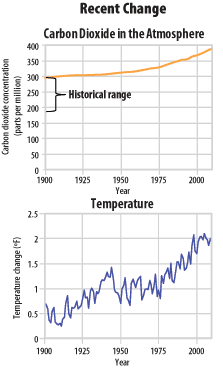
Graph Four: 1900 to the present (2015) .

The current levels of carbon dioxide when compared to air temperatures.
Besides his interests in atmospheric chemistry and geochemistry, his comprehensive
study of the effects of tidal mixing on climate change spans a 1,000-year period. According to Keeling, strong
oceanic tides are the engines behind the warming-cooling cycle that may help determine future climate change. So for the 650,000 year fluctuations see – NASA; cited by – http://globalclimate.ucr.edu/resources.html.
Charles David Keeling, noted atmospheric science researcher, was born in Scranton, Pennsylvania, Keeling received his B. A. degree in chemistry from the University of Illinois in 1948 and a Ph.D. in chemistry from Northwestern University in 1954. Keeling joined the Scripps Institution of Oceanography in 1956. He is a fellow of the American Academy of Arts and Sciences, the American Geophysical Union, the American Association for the Advancement of Sciences, and the National Academy of Sciences.
![]()
![]()
![]()
![]()
![]()
![]()
![]()
![]()
evidence | graphic data | interpreting the data | Implications
Prairie types in North America as an example of anticipated responses due to loss of soil moisture, irregular precipitation, and temperature change that will favor grasses over trees. Millions of years ago as the Rocky Mountains rose gradually from under the sea the prairie vegetation of Canada, the United States and Mexico slowly spread as the grasses adapted over time to the ever more arid conditions along the leeward side of such a high cordillera. That adaptation took millions of years. Currently we are changing such conditions in decades.
Graph Five: 400,000 years before the present:
The Vostok ice cores have been analyzed for atmospheric CO2 content over the last 400,000 years. They show fairly steady CO2 levels until the time of large-scale industrialization.

The portion of the above graphical picture forming a dotted line is the Keeling curve from above.
Graph Seven: 1960 to 1996 detailing variability.
evidence | graphic data | interpreting the data | Implications | links
![]()
The accumulation of heat at the Earth's surface and in the oceans is a measure of increasing entropy, or disorder in thermal conductivity.
Graphics: One, Two, Three, Four, Five, Six, Seven.
Film interpreting these consequences.
Links
Archer | Christianson | Crowley | Dyson | Gelbspan | James Hansen, 04 : Hansen 06 | McKibben| Leggett | Lohmann | Musil | Schmidt | Weart | Wigley
![]()
![]()
![]()
![]()
![]()
![]()