 climate
 Navigating the site:
How Serious is Global Warming ?
ENVIRONMENT
Case Grows For Climate Change
New evidence leads to increasing concern that human-induced
global warming from CO2 emissions is already
here
Bette Hileman C&EN Washington
overview | opposing camps | uncertainties | evidence | El Nino | Ice Sheets | Photograph | Coral bleaching | extreme weather | climate models | upsetting the water cycle | policies
In 1995, the United Nations Intergovernmental Panel on
Climate Change declared: "The balance of evidence suggests a discernible
human influence on global climate." This conclusion set off a major
battle among policymakers, scientists, and industry over the connection
between greenhouse gas emissions and global climate change.
That battle has continued, but in the four years since the UN report was
released, evidence for anomalous warming has become more compelling, and
as a result scientists have become more concerned that human-induced climate
change has already arrived.
Data from many different fields now indicate that Earth is warming and
that significant shifts are occurring in climate and in the biosphere,
at least in part because of human activities. However, major uncertainties
remain that make it difficult to predict the extent of warming or its
consequences over the coming century.
Globally, almost every year since 1990 has
been hotter than the preceding year, according to analysis from many studies.
The average global surface temperature in 1998 was higher than in any
year this century and was in fact higher than it has been at any time
in the past 1,000 years. The tundra, which for millennia has stored large
amounts of carbon in the form of peat, now seems to have become a net
source of carbon dioxide emissions across vast areas of the Arctic.
Return to beginning of the article.
Ocean temperatures during El Niño events since 1980 have been high
enough to bleach corals in many regions, and much of that coral is diseased
or dying. Because of strong warming, large sections of the ice shelves
on the Antarctic Peninsula—ice that has been stable for at least
400 years— have broken up recently.
Few scientists who publish research in the field of global warming believe these changes are entirely due to natural fluctuations in Earth's climate. Only a handful would say that human activities—in particular, burning fossil fuels—have played no role in the global average 0.7 °C (1.2 °C) warming at ground level that has taken place since the late 1800s.
It is highly probable that the greenhouse gases added to the atmosphere
since the start of the Industrial Revolution have directly acted to heat
up the planet and will heat it further over the coming century, says Jerry
D. Mahlman, director of the National Oceanic & Atmospheric Administration's
(NOAA) Geophysical Fluid Dynamics Laboratory in Princeton, N.J. Mahlman
Return to beginning of the article.
However, scientists fall into two camps when
they consider what society's response to global warming should be. Some
believe Earth's climate is already showing strong signs of instability
and is causing alarming changes in sea ice and the biosphere. Consequently,
they say governments and individuals need to take immediate action to
curb emissions.
"Given the time frame over which these things, such as coral bleaching,
are expressing themselves—decades, not centuries—we don't have
time to take anything other than the precautionary principle as our appropriate
role," says James W. Porter, a professor of ecology and marine sciences
at the University of Georgia, Athens. ``The precautionary principle says,
if the scientific evidence is incomplete, you shouldn't do anything to
make the situation worse." The alternative, he says, should not be
"if you don't understand everything, you should shut up and do nothing.''
Other researchers believe there are some large uncertainties in global
warming science that need to be eliminated or reduced before governments
mandate strong, potentially expensive, measures to reduce emissions. ``We
need to take the steps now to make the political agreements and develop
the technological capabilities to substantially lower emissions if and
when the science shows that to be necessary,'' says Ronald G. Prinn, director
of the Center for Global Change Science at Massachusetts Institute of
Technology.
Return to beginning of the article.
Several major questions dominate the unknowns of
global warming science. These concern what effect clouds, aerosols,
ocean circulation, and vegetation (its uptake or emission of carbon dioxide)
will have on global warming over the coming century. Another important
question is: What kinds of regional changes in climate might be expected
as Earth warms? Satellite and ground-based instruments for the Earth Observing
System that the National Aeronautics & Space Administration will deploy
over the next 15 years are designed to help resolve these questions.
In recent international negotiations, the U.S. has advocated using reforestation
and the incorporation of carbon in agricultural soils as a carbon dioxide
sink to achieve a substantial part of the greenhouse gas emissions reductions
agreed to under the 1997 Protocol to the United Nations Framework Convention
on Climate Change—known as the Kyoto protocol. But many scientists
and the European Union are skeptical about depending heavily upon this
approach.
Return to beginning of the article.
Evidence pouring in from many different fields indicates a speedup in the rise of Earth's surface temperature. Globally, 11 of the past 16 years have in turn been the hottest of the century, according to a NASA report. The average global temperature in 1998 exceeded the previous record set in 1995 by 0.25 °C—a huge jump. The average global temperature in 1995 was already about 0.75 °C above temperatures during the late 1800s. Some of the warming in 1998 can be explained by the El Niño phenomenon that year, but not most of it, says James E. Hansen, director of NASA's Goddard Institute for Space Studies in New York City. (El Niño is the periodic, marked warming of the central and eastern tropical Pacific Ocean that can spawn droughts and floods worldwide.)
In addition, the rapid temperature rise of the past 25 years exceeds the
rise seen in any previous period of equal length during the past century
since reliable instrumental data have been available. This accelerated
warming has been occurring just as models have predicted—during the
time when greenhouse gases in the atmosphere (about 80% carbon dioxide)
have increased most rapidly, Hansen says.
When "proxy" records—such as tree rings, pollen, sediments,
and gases trapped in glaciers—are used to estimate global temperatures
in the distant past, 1998 stands out as a record hot year for the millennium,
says Michael E. Mann, adjunct assistant professor of geosciences at the
University of Massachusetts, Amherst. The average
global temperature last year exceeded temperatures in the so-called medieval
warm period, he says.
"The notion of the medieval warm period is really outdated,'' Mann
says. Temperatures in Greenland were unusually high from about 900 to
1100, allowing the Norse colonization, but that was a regional phenomenon,
he explains. Europe warmed a few centuries later, but that warming was
also confined to a small part of the planet. ``There
is no evidence of any period of warmth at the hemispheric scale that rivals
the late 20th century,'' he explains.
Return to beginning of the article.
Global temperatures in the late 20th century are a cause for concern,
Mann says. "Any time a scientist sees a system exhibit very anomalous
behavior all of a sudden, it is reason to be very cautious about whatever
it is that might be perturbing that system," he says. "There
could be obviously deleterious and relatively unpredictable effects because
we're changing the system so quickly."
As Earth's temperature has risen, most polar regions have warmed much
more than the global average. Alaska, for example, has been as much as
6 °C(10 °C) warmer recently than it was 35 years ago, and this
causes the Alaskan tundra to melt more in the summer than it used to.
It also means that vast areas of the tundra that formerly were a sink
for carbon dioxide now have become net sources, according to Walter C.
Oechel, director of the Global Change Research Group at San Diego State
University. The tundra has deep layers of peat that decay and release
carbon dioxide when warm.
Oechel has been measuring carbon dioxide emissions and absorption (flux)
over an area about the size of the Netherlands on Alaska's North Slope.
Using towers, chambers, and aircraft, he has found that essentially all
of this area is now a net carbon dioxide source on an annual basis.
Measurements in the 1960s and early 1970s show that the Alaskan tundra
was a carbon dioxide sink at that time, Oechel says. ``The first year
when we saw areas of the Arctic become sources during the summer was 1982,''
he says. From carbon-14 data for the peat, he concludes that "the
tundra was basically a sink going back 9,000 years before present."
Oechel and several other research groups are extending flux studies to
the Seward Peninsula in western Alaska and to the adjacent Chukota Peninsula
in Russia. They are finding that the Russian tundra also is a source.
"The overall pattern is that the extrapolar Arctic tundra is a source
to the atmosphere," he says. "The two vegetation types we've
looked at—tussock tundra and wet tundra—are emitting about ;5>0.7
billion metric ton of carbon dioxide a year [measured as carbon],"
he estimates, compared with about 7 billion metric tons released annually
from burning fossil fuels and from deforestation.
Return to beginning of the article.
In addition to tundra, scientists are measuring how much CO2 is emitted
or absorbed by forests. Michael L. Goulden, an assistant professor of
earth system science at the University of California, Irvine, and his
collaborators have been using gas-exchange chambers; radiocarbon analysis;
and wood, moss, and soil inventories to measure the carbon balance of
a 120-year-old black spruce forest in Manitoba. They found that the site
has lost ;5>0.3 metric ton of carbon per hectare per year from 1994
to 1997 [Science, 279, 214 (1998)]. The gain in wood carbon was more than
offset by losses from the soil. "The soil remained frozen most of
the year, and the decomposition of organic matter in the soil increased
10-fold upon thawing," he writes.
Steven C. Wofsy, a professor of atmospheric and environmental science
at Harvard University, has been measuring carbon fluxes in a variety of
forests. Measurements made by Wofsy show that certain types of boreal
(high-latitude northern) forests are definitely not taking up any carbon,
he says. But there aren't enough measurements yet to give a comprehensive
picture of how much carbon dioxide boreal forests are absorbing or emitting
overall, he says. "The atmospheric data, though, would suggest the
boreal zone is not a very strong sink and may be a source today,"
Wofsy notes.
All this research shows that as climate
warms in the tundra or in the boreal forests, it can transform them from
sinks to sources.
Return to beginning of the article.
Average summertime temperatures on the Antarctic Peninsula have risen
2.5 °C (4.5 °F) since the 1940s and are now just above 0 °C,
according to data from the British Antarctic Survey. This strong warming
seems to have led to increased colonization by plants at certain sites
in the region and to have accelerated the breakup of ice shelves on the
peninsula. Two ice shelves, Larsen B and Wilkins, lost nearly 3,000 sq
km (1,200 sq miles) of their total area of 24,000 sq km in the past year,
according to David Vaughan, a British Antarctic Survey researcher.
"We have evidence that the shelves in this area have been in retreat
for 50 years," with cumulative losses amounting to about 7,000 sq
km, he says. So retreat of 3,000 sq km in a single year is clearly an
escalation, Vaughan says. The recent breakup was also unusual because
the ice shelves calved thousands of small icebergs at once, while normally
they release only a few relatively large icebergs in any single year.
Return to beginning of the article.
| Sidebar: New satellite network will aid climate-change research |
|
| "Within a few years, much of the Wilkins Ice Shelf will likely be gone," Vaughan predicts. Although the breakup and melting of an ice shelf does not contribute to sea level rise because the shelf is originally floating on water, this phenomenon has an important effect. When an ice shelf is gone, the ice sheet (the huge glacier resting on land) behind the ice shelf would tend to melt faster because there is nothing to stop it from flowing out over the ocean, in what a NASA report calls an irreversible process. | 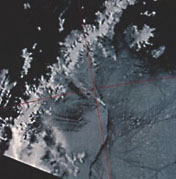 |
Return to beginning
of the article.
The Greenland Ice Sheet, the world's second largest glacier, has begun to thin by up to a meter per year when losses are averaged over the whole ice sheet, according to NASA surveys completed this year. In 1994, NASA researchers using aircraft equipped with laser altimeters measured the profile of the 10 million-sq-km ice sheet. This year, researchers flew on the same path and found that the ice sheet had lost up to 5 meters in thickness. The west side of the ice sheet had lost no net ice, but the east and south sides had thinned substantially, leading to an overall loss. Significant melting of ice sheets would contribute to a sea level rise.
However, because snowfall could be increasing in polar regions, researchers
still do not know whether the overall mass of all the world's polar ice
sheets is growing or shrinking, NASA reports. There is no evidence yet
that the huge ice sheet that covers the Antarctic continent is thinning.
Return to beginning of the article.
Another effect believed to be caused at least in part by the recent rise in global temperatures is that record seawater temperatures have triggered the largest die-off of coral ever observed. "Worldwide episodes of coral bleaching, coral disease outbreaks, and macro algal overgrowth of coral are increas-ing in frequency, intensity, and range," says the University of Georgia's Porter. Bleaching occurs when coral becomes stressed and expels its microscopic plant life, which provides it food.
These events are occurring in all reef-supporting regions, including the Indo-Pacific, the western Atlantic, and the Caribbean, and are affecting reefs near both inhabited and uninhabited regions. Scientists attribute the coral decline to seven causes--coastal development, global warming, oxygen starvation, sediment loading (including dust from the Sahel, the semiarid fringe of the Sahara, in Africa during drought years), destructive fishing practices, overfishing of plant-eating fish, and increased ultraviolet radiation from stratospheric ozone depletion.
But only global warming and enhanced UV radiation are ubiquitous enough to affect coral globally in remote as well as inhabited areas, Porter says. Another clue to causality is that changes in the coral ecosystems started abruptly in the mid-1970s, just when global temperatures began rising rapidly, he says.
Coral bleaching has been particularly pronounced in El Niño years, especially during severe events, such as the one in 1998, Porter says. Since the mid-1970s, a number of very intense El Niños have occurred when seawater temperatures have been unusually high, Porter says. If the water temperature rises to 31.5 C, only 1.5 C above the summertime seawater average in the tropics, corals are bleached.
Coral can often recover from short bleaching episodes, but it becomes diseased or dies when subjected to prolonged or repeated bleaching. Bleaching weakens coral's ability to resist pathogens or competitors, Porter says. "We are now seeing at least 14 diseases in coral, some of which appear to be new in that they have not been described before," he says.
Return to beginning of the article.
Porter currently is collaborating with the Environmental Protection Agency on long-term monitoring of coral reefs. In just three years, he has found a huge increase in the number of monitoring stations in the Florida Keys with diseased coral. In 1996, there were 26 out of 160 EPA monitoring stations with disease. In 1998, 131 stations exhibited disease. Furthermore, the number of coral species affected by disease in the Florida Keys has tripled over those three years. "No coral reef in Florida could have grown with the rates of loss now being seen," Porter says.
Reefs are threatened not only by rising temperatures but also by the modified chemical composition of the surface ocean water. Higher atmospheric concentrations of carbon dioxide result in enhanced absorption of carbon dioxide by the surface ocean. This, in turn, lowers the concentration of carbonate ion, reducing the ability of corals to build their skeletons (made of calcium carbonate in the form of aragonite).
Joan A. Kleypas, a chemist at the National Center for Atmospheric Research (NCAR), Boulder, Colo., has found that the addition of extra carbon dioxide to surface ocean water has already reduced calcification rates on some reefs by 6 to 11% [Science, 284, 118 (1999)]. She estimates that calcification rates would decrease by an additional 8 to 17% if the carbon dioxide concentration in the atmosphere were to rise from its current level of 360 ppm to double the preindustrial level (about 550 ppm) as some models predict will happen by 2050.
Coral reefs are important because they are biologically diverse and beautiful marine ecosystems. They are important for tourism in many areas and provide food, coastal protection, and new medications for drug-resistant diseases. For example, Caribbean countries derive half their gross national product from reefs, and the coral reefs of Southeast Asia harbor one-quarter of the world's fish species. The World Resources Institute, Washington, D.C., estimates that the world's reefs provide $375 billion each year in goods and services.
Return to beginning of the article.
At the same time that changes have been taking place in coral, weather patterns have been shifting in ways that lead some scientists to believe that climate has become unstable.
Thomas R. Karl, director of NOAA's National Climatic Data Center, Asheville, N.C., has analyzed weather records for the past century and found much evidence of an enhanced hydrological cycle. From his analysis, he concludes that precipitation has increased about 10% across the contiguous U.S. since 1910, with much of the increase occurring in winter. Also, the proportion of total precipitation coming in very heavy events has risen relative to more moderate episodes, he says. For example, the frequency of extreme daily rainfall events (specifically, days with rainfall exceeding 2 inches) has increased by about 10% during the past century. Analyses of precipitation in Canada, Japan, Russia, China, and Australia show similar trends [Bull. Am. Meteorol.Soc., 79, 231 (1998)].
Another sign of an enhanced hydrological cycle, Karl says, is that the moisture in the lower atmosphere in the U.S. has increased 5% per decade over the past 20 years. This is a consequence of simple physics: As temperatures rise, more water evaporates. Enhanced water vapor and increases in sulfate aerosols lead to more clouds, which tend to reduce temperatures during the day and raise them at night. As a result, daily low temperatures in the U.S. have increased at nearly twice the rate of the daily highs. Similar trends can be seen in most other parts of the world.
Return to beginning of the article.
Further evidence of an enhanced hydrological cycle has been an increase
in the number of intense storms over the North Atlantic and North Pacific
Oceans, Karl says. This number has doubled since 1900.
In contrast, the frequency of tropical cyclones has decreased
overall. This is not surprising, says Kevin E. Trenberth, chief of the
climate analysis section at NCAR. "With increases in sea-surface
temperatures, there is a potential for stronger, bigger hurricanes,"
he says. On the other hand, he explains, groups of thunderstorms can substitute
for a hurricane as a mechanism to transport heat upward. So there is always
a trade-off between the two. However, it is very difficult to detect trends
in hurricanes because they fluctuate so much from year to year.
Return to beginning of the article.
For El Niño events, which are a major cause of widespread
floods and droughts around the world, the trend is more clear-cut. There
have been more frequent and more intense El Niños since the late
1970s, Trenberth says. The two most severe El Niños on record occurred
in 1982-83 and in 1997-98, and the longest on record persisted from 1990
to mid-1995.
There are reasons to think that global warming increases both the frequency and intensity of El Niño events, Trenberth explains. "The timescale of El Niño is determined by the time required for an accumulation of warm water in the tropics to essentially recharge the system, plus the time for the El Niño itself to evolve. Because El Niño is involved with movement of heat around, it is conceptually easy to see how increased heating from the buildup of greenhouse gases can interfere." As yet, however, there is no scientific consensus on how El Niños are affected by rising global temperatures.
Along with changes in the hydrological cycle and in the El Niño phenomenon has come a sharp rise in the incidence of and damages from severe weather events around the world. Munich Re, a reinsurance company based in Munich, Germany, estimates that global losses from weather-related natural disasters have increased from between $7 billion and $10 billion annually in the 1980s to about $90 billion annually in 1998.
Part of the reason damage costs have risen so much is that governments and insurers in developed countries have made inexpensive insurance widely available and this has encouraged people to build near the seacoast. But at the same time the sheer number of severe weather events has also escalated.
Because of the ongoing climate changes, Karl says, effective future government planning needs to account for a nonstationary climate. "We cannot rely on the past climate to guide us into the future," he says.
Return to beginning of the article.
There is no "smoking gun" in global climate research that provides a near-absolute link between carbon dioxide emissions and climate change. But the newest general circulation models give results that, in the opinion of many scientists, come close to being a smoking gun. These models are very similar to those used for long-range weather forecasts.
In 1990, when general circulation models were used to project temperature
rises resulting from increasing greenhouse gases in the atmosphere, the
modeled temperatures for the past century were not very close to the observed
data. The models predicted a temperature rise of 1.2 C from greenhouse
gases during the 20th century, when the actual rise was about 0.7 C.
But in 1995, when data on the cooling effects of sulfate aerosols and
changes in the sun's irradiance were added to the models along with greenhouse
gases, the model-predicted warming closely agreed with observations. There
was also a close correspondence between model-predicted and observed patterns
of temperature changes in the horizontal and vertical planes, says Tom
M. L. Wigley, senior scientist at NCAR. That is, the model-predicted temperature
and precipitation patterns on continental and high-latitude/low-latitude
scales were close to those seen in reality, he explains. Also, the pattern
of temperatures predicted for different levels of the atmosphere was close
to the measured pattern. "The skeptics' view that the models are
inconsistent with observations is just not correct," he says.
"If one takes off the shelf the best information about greenhouse
gas concentrations, the best information about sulfate aerosol forcing
(the warming or cooling result), the best information about solar forcing,
and the best estimate about climate sensitivity (that is, how many watts
per square meter of warming result from a given concentration of greenhouse
gases), then what you get" is very close to the observations, Wigley
explains.
Although the most sophisticated models give fairly realistic results for
temperatures in the past, model predictions of the temperature changes
to be expected in the next century vary widely. Models project average
global temperature increases of 1.2 to 4 C compared with the 1990 global
average if nothing is done to curb greenhouse gases. In Wigley's view,
the best estimates range between 1.9 and 2.9 C.
Return to beginning of the article.
Some scientists say a global average temperature rise close to 1 C--the
lowest change projected for the next century--would have minimal effects.
But Mann disagrees. A 1 C global average rise could have very noticeable
effects on climate and the biosphere because the rise in polar regions
and even in the continental U.S. would be much greater than 1 C, he says.
One of the inputs that always makes temperature projections from climate
models for the next century vary over a wide range is estimating how fast
greenhouse gas concentrations will rise. That depends on many different
human factors, including choices people make affecting population, changes
in land use, and the structure of industry. It is impossible to eliminate
all the uncertainties associated with future human behavior.
Other large modeling uncertainties result from a lack of scientific understanding
about the physical effects of aerosols, clouds, and ocean circulation
in a warmer world.
Aerosols--tiny particles suspended in air--originate from sea spray, volcanoes, dust storms, and wildfires, as well as fossil-fuel burning, agriculture, and forestry. Scientists do not know where on Earth aerosols are increasing or decreasing. Nor do they understand how the effects of aerosols might change as greenhouse gas concentrations rise.
Preliminary results from a project to study aerosols over the Indian Ocean
have produced many surprises and illustrate how little is known about
aerosols, says V. (Ram) Ramanathan, director of the Center for Atmospheric
Sciences at Scripps Institution of Oceanography, La Jolla, Calif. In a
National Science Foundation-sponsored project, scientists from Scripps
and the Max Planck Institute for Chemistry, Mainz, Germany, used aircraft,
ships, balloons, satellites, and land stations to study aerosols and clouds.
The aerosol layer--consisting of soot, sulfates, nitrates, and organics--was
surprisingly persistent and thick and covered most of the Indian Ocean,
Ramanathan says. A second unexpected finding was that the reduction of
sunlight at the surface caused by the aerosols was three times as great
as the amount of sunlight the aerosols reflected into space. Usually,
the amount of sunlight reflected into space is the only measurement taken
of the radiative properties of aerosols, he explains.
Return to beginning of the article.
Another of the more important uncertainties in climate modeling is how
the cloud system reacts in response to increases in the levels of greenhouse
gases. In general, high clouds warm the climate while low clouds, by reflecting
sunlight back to space, tend to cool the system. Overall, clouds averaged
together globally now have a net cooling effect of -15 to -20 watts per
sq meter, Ramanathan says. However, scientists do not know how clouds
will respond to further increases in greenhouse gases, he says.
NASA's Earth Observing System, which consists of satellite-based and ground-based
instruments, is designed to reduce many of the uncertainties concerning
clouds and aerosols. Data obtained will be used in complex Earth system
models in climate projections for the next century and to help in predicting
regional changes in climate with increasing levels of greenhouse gases.
A minimum of 15 years of continuous monitoring is believed to be needed
to identify meaningful climate trends and to separate human effects from
naturally occurring ones.
Insistence on sinks
In the international negotiations over what to do about the potential
problems of global climate change, beginning with those in Kyoto, the
U.S. delegation has been advocating reforestation and the incorporation
of carbon in agricultural soils as a substitute for reducing emissions
from burning fossil fuels. The U.S. aims to use sinks to achieve a substantial
part of the 7% reduction in greenhouse gas emissions below the 1990 level
by 2012 as promised in Kyoto. Government statements submitted to the UN
by the State Department say that using sinks is often more economical
than cutting back on the use of fossil fuel.
Return to beginning of the article.
Although research on carbon sequestration in forests and soils
had been going on for decades, the U.S. government did not seem to have
an intense interest in this topic until about the time of the Kyoto negotiations
in December 1997. At that time, a draft paper by a group at NOAA's Geophysical
Fluid Dynamics Laboratory was being circulated among the delegates. The
paper, which was later published in Science, concluded that the forests
and soils of North America, especially those below the 51st parallel,
were absorbing as much or more carbon than the U.S. was emitting from
burning fossil fuel [Science, 282, 442 (1988)].
According to the paper, North American forests and soils were sucking
up 1.7 billion metric tons of carbon dioxide (measured as carbon) annually--the
entire so-called missing sink--while the rest of the world was taking
up very little carbon dioxide. The paper was one reason U.S. policymakers
came to believe that enhancing forest and soil carbon sequestration had
great potential as an economical way to offset emissions reduction targets.
In Kyoto, delegates from the European Union believed that the U.S. interest
in sinks had come out of the blue; they were very skeptical about including
sinks in the protocol. At one point, the U.S. delegation threatened to
walk out of the negotiations if sinks were not included.
Return to beginning of the article.
In the past year, two more groups--one in Australia and one in France--have
completed similar research and have come to different conclusions that
show U.S. vegetation is taking up much less carbon dioxide than the NOAA
researchers found. However, these new research results are not yet published
and have had no noticeable effect on climate-change policy.
The sinks issue has been dominating every negotiating session since Kyoto,
says Kevin R. Gurney, a research scientist in the department of atmospheric
science at Colorado State University, Fort Collins, who served as an expert
at the negotiations. "A lot of the delegates are just perplexed"
because the issue is complicated and the science is not very mature, he
explains. "It's difficult for them to negotiate issues that seem
very vague and fuzzy."
When greenhouse gases, aerosols, and changes in solar irradiance are used
as inputs into general circulation models, predicted temperatures are
very close to those observed. When greenhouse gases are the only input,
as was done in the past, predicted temperatures are higher than those
observed.
But many scientists favor using forest sinks as one way of reducing emissions
under the protocol. "The world would be a better place with more
forests for many reasons--preservation of biodiversity and production
of forest products," says William H. Schlesinger, a professor of
botany and geology at Duke University. He has been experimenting with
13-year-old loblolly pine trees grown outside to see how they respond
to enhanced levels of carbon dioxide. After three years, trees nourished
with enhanced carbon dioxide grew 25% faster than controls [Science, 284,
1177 (1999)].
Return to beginning of the article.
Schlesinger and his collaborators estimate that if atmospheric carbon dioxide levels double to 560 ppm sometime in the next century as predicted, the world's forests could absorb 50% of the fossil-fuel emissions as an upper limit. But that would be an unrealistic goal, he says, achievable only if all the trees were relatively young and all were as responsive to carbon dioxide as the most responsive tree--the loblolly pine. Also, it is unclear whether the enhanced growth of trees would be sustained for more than a few years, he says.
Harvard's Wofsy also is in favor of using forests and soils as a way to get credit for carbon dioxide reductions. But, he says, people need to decide what the overall objectives are. These objectives should put the management, stewardship, and ecological services of the forests and soils first and the advantages of carbon reductions second, he believes. "A spreadsheet approach will lead to a big push from Wall Street to plant short-rotation, fast-growing tree plantations and ignore other environmental considerations," he says.
Widespread use of forests and soil sequestration as a substitute for reductions in fossil fuel use can backfire, Gurney warns. "The problem is that it's entirely possible every bit of carbon that goes into these systems now will come right out" as temperatures rise. To use sinks, he says, "you have to account for sink carbon forever, so if it comes out of forests or soils, countries [should be] penalized for that."
Return to beginning of the article.
Some scientists believe Congress  is
taking an ostrichlike approach to climate-change issues. Last month, 50
climate-change researchers met in Washington, D.C., in an effort organized
by the Union of Concerned Scientists to try to convince Congress that
global warming is a serious issue and to urge the Senate to ratify the
Kyoto protocol. Since the Kyoto protocol was negotiated, Congress has
for the most part been opposed to doing anything that might eventually
reduce greenhouse gas emissions. There has been some funding for research
on climate change and for research on nuclear and renewable energy, however.
is
taking an ostrichlike approach to climate-change issues. Last month, 50
climate-change researchers met in Washington, D.C., in an effort organized
by the Union of Concerned Scientists to try to convince Congress that
global warming is a serious issue and to urge the Senate to ratify the
Kyoto protocol. Since the Kyoto protocol was negotiated, Congress has
for the most part been opposed to doing anything that might eventually
reduce greenhouse gas emissions. There has been some funding for research
on climate change and for research on nuclear and renewable energy, however.
There is virtually no chance the Senate will ratify the Kyoto protocol during the Clinton Administration. In fact, most members of Congress seem to agree with the view of Rep. Jim Sensenbrenner (R-Wis.) that the Kyoto protocol "poses a severe threat to the vitality of the U.S. economy in the form of drastic energy price increases, job losses in key manufacturing industries, and an overall decline in our standard of living." In March, Sen. John H. Chafee (R-R.I.) introduced S. 547, a bill to encourage companies to reduce their greenhouse gas emissions in return for credits usable in any future climate-change program. But this bill also has little chance of passage.
In April, Sen. Frank Murkowski (R-Alaska) introduced S. 882, a bill that
would reduce and sequester greenhouse emissions through clean-coal technologies,
provide $2 billion over 10 years for R&D on various technologies that
would reduce greenhouse gas emissions, and consolidate climate-change
duties in one office at the Department of Energy. Environmental activists
oppose Murkowski's bill, saying that while R&D is important, more
immediate steps are necessary to reduce emissions. Partly as a result
of congressional inaction, the U.S. has made little progress toward meeting
its goal of reducing greenhouse gas emissions 7% below the 1990 level
by 2012. DOE's Energy Information Administration (EIA) has reported that
U.S. emissions last year were more than 10% above the 1990 level.
Return to beginning of the article.
EIA's 1998 emission figures also show that U.S. industry made some surprising progress last year in reducing carbon dioxide emissions. In 1998, fossil fuel use in the industrial sector fell 1.4% from the 1997 level, even as the gross domestic product grew 3.9%. This is the first time U.S. industrial use of fossil fuel has fallen in a strong economy. Emissions from 1997 to 1998 for the U.S. as a whole grew only 0.4%.
Table: Worldwide carbon dioxide emissions fell in 1998
Perry Lindstrom, EIA industry economist, says he does not know why industrial
emissions went down, nor does he know whether the trend will continue.
"Part of the downward movement has to be the result of a changing
structure in the U.S. economy," he says.
Similar trends can be seen around the world. Worldwide carbon emissions
fell 0.5% last year while the world economy expanded 2.5%, according to
figures from BP Amoco and the Worldwatch Institute, a Washington, D.C.-based
public policy research organization. This shows there is a disconnect
between economic expansion and carbon emissions, says Christopher Flavin,
Worldwatch senior vice president. If that falling trend continues, it
may demonstrate that cutting carbon emissions and maintaining economic
growth may be easier than previously thought.
Research that casts light on global climate change is now published every week, and new data from NASA's Earth Observing System likely will provide much information that will help eliminate uncertainties over the next 10 to 15 years. Although the data may build an increasingly stronger case that greenhouse gases from the burning of fossil fuels are altering climate, they may never prove it absolutely.
So policy debates over whether the government should mandate major reductions in emissions now or wait for more scientific certainty may well continue for a number of years. But eventually climate change and its associated harm to ecosystems may seem so ominous that a consensus among policymakers, scientists, and the general public will develop to take strong measures to reduce greenhouse gases, even while important scientific questions remain unanswered.
Return to beginning of the article.