Evidence for a change in the Earth's atmospheric chemistry.
The past century | Past fifty years | Broecker's signal | the dilemma | A geologist's perspective | Crowley's arguments
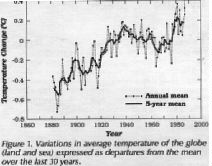
For more than a century from 1880 to 1990, the above graph reveals a world average change in the annual mean range of high and low temperature's.
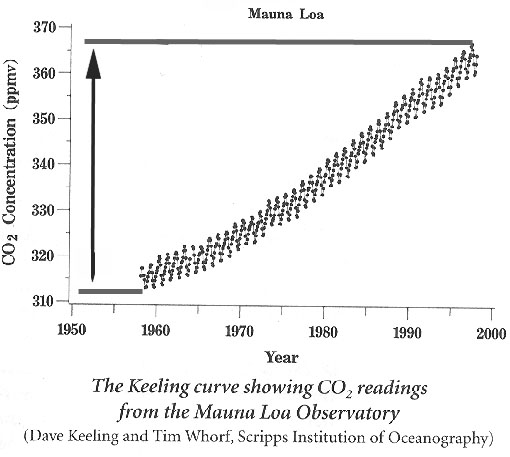
For the period since 1958, the amount of carbon dioxide in the high atmosphere has been measured in the Hawaiian Islands and reveals a 50 /310 ppmv rise in four decades, about 4.25 ppmv per decade increase in atmospheric carbon vapor gas.
Testing the hypothesis that excessive carbon emissions can account for expected temperatures; just follow the blue line (if climate change where natural there would be cooling), but follow the green line for the impacts of human induced changes due to deforestation and combustion.
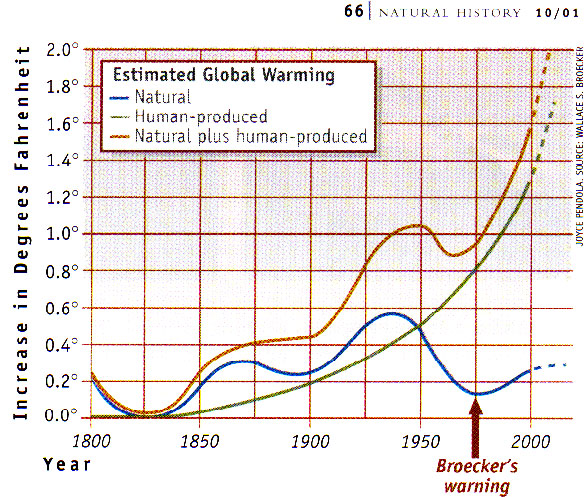
American Museum of Natural History researcher Wallace Broecker has laid to rest the familiar response of the carbon waste producing industrial spokesman that the change in temperature is a natural cycle.
To to this Broecker identified a divergence between the expected temperatures, if carbon dioxide emissions were to stay constant (blue--bottom line). Around 1950 the human produced heat based on excess carbon dioxide emissions (green --exponentially rising-- line) intersects and exceeds the amount of expected natural variation. To Broecker, the warning signal about 1975 indicates that instead of the anticipated cooling from natural variation, the temperature began to climb.
To account for the record highs from 1994-1999, atmospheric chemists have speculated that methane and other carbon rich vapor gas compound emissions in the air have accelerated. Because the heat absorption potential of these so called "greenhouse gases" is calculable, the more emissions released into the atmosphere, and the longer they remain aloft, the greater the rise in temperatures.
To test the hypothesis further, ocean surface temperatures, and Atlantic bottom water temperatures reveal the warmest readings in a century, since records were first kept in the 1880s.
The majority of scientists believe that there is great uncertainty about what happens at the highest or threshold temperatures on the planet melting sea ice can, with sufficient volume of water, alter surface and bottom currents in the Atlantic Ocean.
The minority report insists that we are either half way through an interglacial warm period, or we are after 10,000 years heading for another ice age. Broecker's data then suggest that thermal air pollution is prolonging the interglacial or forestalling a return to the accumulating ice and snow, characteristic of past ice ages.
Stanley Chernicoff, geologist explains:
"The Pleistocene record suggests that interglacial periods have an average length of 8,000 to 12,000 years, followed by 10,000 years to 20,000 years of slow, intermittent cooling, before glacial conditions return....We are now in an interglacial period that began about 10,000 years ago. This period may be drawing to a close..."
He suggests:
"If we let CO2 (carbon dioxide) production go unchecked for the next 2000 years, however, the very high level of CO2 buildup will coincide with a warming trend predicted by Milankovitch's Earth-Sun orbital factors. The result could be an unusually intense warming and a period of super-inter-glaciation. If human-induced warming can be curtailed, then the Milankovitch factors predict that ice sheets will again cover vast areas of North America and Europe about 23,000 years in the future."
p. 502
The current integlacial is unstable, thus any rapid changes could cause biological consequences we are not ready to which we cannot effectively respond, (Siry, commentary.)
And
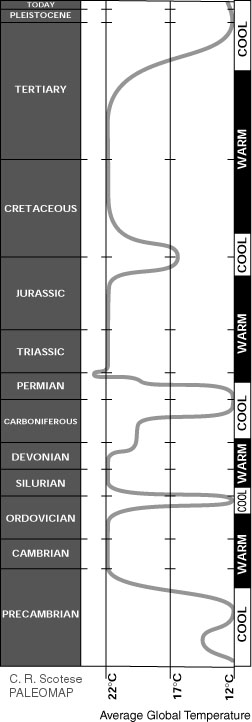
"Although the most recent (Quaternary) ice age is associated with the start of the Pleistocene 1.6 million years ago, the Earth had actually been cooling for about 50 million years prior to that time.
(Eocene –in the Tertiary– was the start of a series of recurring ice ages with glaciers developing in Antarctica during the Oligocene (36.6 - 23.7 mya); during the Late Cretaceous –well over 65 million years ago– the earth was warmer by about 10 degrees Celsius than it is today.)
p. 496.
the past century | Past fifty years | Broecker's signal | the dilemma | A geologist's perspective | Archer | Crowley's arguments
last 2 million years | recent findings | literature sources | solutions | subject index
Science Index | Albedo | Analysis | isotope analysis | Population Index | Nature Index | Research sites.
Terms | Glossary | Word webs | Basic vocabulary | Advanced Vocabulary | Antonyms | Synonyms
Writing | Interviews | Free Writing