The American Conservation movement
"When we destroy ecosystems and extinguish species, we degrade the greatest heritage this planet has to offer and thereby threaten our own existence."
Wilson, p. 39
![]()
 Third Wave: America's New Conservation, Conservation Yearbook No. 3 (Washington: GPO, 1966);
Stewart L. Udall, The Quiet Crisis. New York: Holt, Rinehart & Winston, 1963.
"consider the weightiest problem now before the Nation; and the occasion for the meeting lies in the fact that the natural resources of our country are in danger of exhaustion if we permit the old wasteful methods of exploiting them longer to continue."
President Theodore Roosevelt's 1908 speech, "Conservation as a National Duty," Washington, D.C.
![]()
Forests reserves as timber sources or as watershed protection for wild & scenic resources?
| Conservationist | Preservationist |
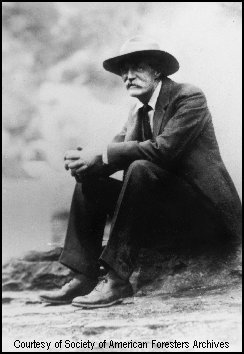 |
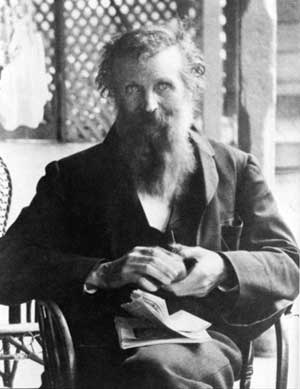 |
| Gifford Pinchot | John Muir |
Conservation versus preservation.
The three waves of the progressive conservation movement
Pre-operative steps: 1871-1902, incipient efforts for fishery, forests, parks, geology, antiquities, and wildlife preservation
First Wave: 1902-1909, Gifford Pinchot – "formal" conservation From the Bureau of Reclamation to the Governor's Conference, 1908.
Second Wave: (1933-1942) Harold Ickes – failed to create a Conservation department (like Department of Interior)
Third Wave: (1960-1972) Stewart Udall – "environmentalism" Endangered Species, Wilderness, Water & Air to EPA: the National Environmental Protection Act (NEPA) created the sub-cabinet Agency and the Council on Environmental Quality, CEQ.
What | When | Where | How | Splits | Schisms | Housing boom | Adam Rome's argument | Timothy Egan's argument | Sources
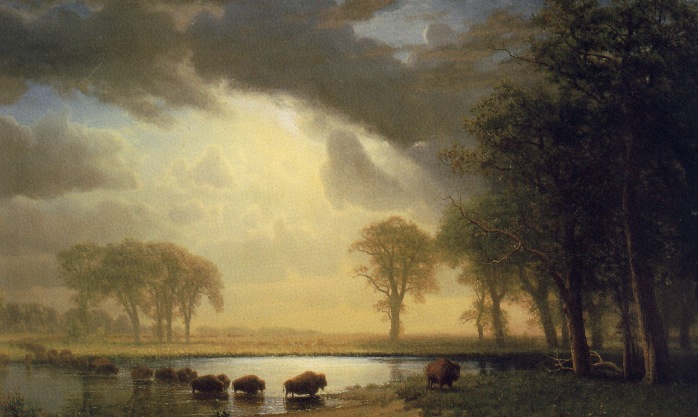
The failures of conservation as indicated by a schism, or a deeply divisive split in the movement between 1890 and 1921 is but an indicator of the widespread strengths as opposed to some intense and focused weaknesses of the movement.
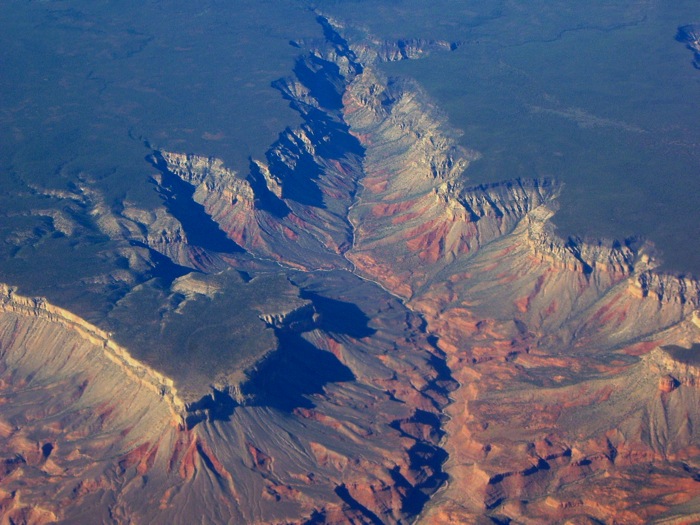
“The biosphere is now being profoundly reshaped by human society, and the pace of that change now appears to be exceeding the highest rates seen in the past 65 million years”
(Ehrlich and Ehrlich, The Dominant Animal, page 193).
What | When | Where | How | Splits | Schisms | Housing boom | Adam Rome's argument | Timothy Egan's argument | Sources
What had we lost in the scramble for cheap, comfortable, and clean homes for 60 million families?
The suburban migration of the United States' urban population from 1945-2008 posed a serious challenge to the above bipartisan conservation tradition. That is a nation-wide tradition supported by progressives, Republican and Democratic parties alike. Not until 1980 did that agreement on the part of both parties on the need for environmental protection break down.
The demand for timber, asphalt, concrete and copper electrical wiring alone directly affected forestry, mining and and Federal oil reserves. Land-use consumed acreage while water and air pollution demanded new laws.
The direct and indirect consequences of the mass migration away from cities and the urban core were seen as a threat to natural resources by the "Open Space" movement, but widely ignored as an enduring source of immediately lucrative investments. Paradoxically the housing boom also contributed in part to the nation's financial and economic failures,in addition to a prolonged binge of environmental deficit spending.
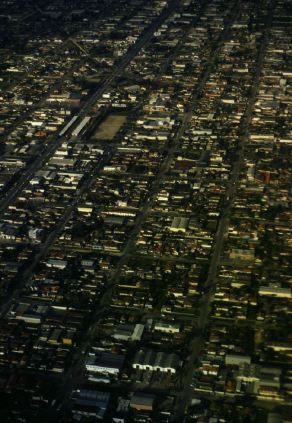 • What had been lost in the scramble for cheap, comfortable, and clean homes for 60 million families in the 1945 - 1995 period was the integrity of land, air, and water as a viable unit called "open space" that the Johnson's thought possessed beauty or the potential for a complete beautification of America.
• This response to the suburban land, real-estate boom and later bust was but one of the sources of the third wave of conservation, called "environmental conservation" by Raymond Dasmann.
√ But if ecological integrity were actually taken to it's logically coherent level of analysis, the losses determinable in terms of water, energy, air, and landscape (WEAL) amounted to a "revolution" in land- use controls that would have been required if conservation was to remain a serious part of this nation's agenda.
San Fernando Valley real estate boomed with cheap Owen's Valley water.
What | When | Where | How | Splits | Schisms | Housing boom | Adam Rome's argument | Timothy Egan's argument | Sources
Where the development was extensive.
What | When | Where | How | Splits | Schisms | Housing boom | Adam Rome's argument | Timothy Egan's argument | Sources
Housing: Half of the houses in the USA (150 million +) were built before 1973; 32 million are in central cities and 52 million in suburbs. 76 million are single family and 6 million condominiums.
Consumption means that 85% of US homes have air conditioning, 48% have a separate dining room and 34% have a working fireplace. Approximately 2 million houses were built in 2005 and 2006 and about 1.5 million in 2007.
When homes were built:
Years Total housing units Seasonal Total occupied total owner renter total vacant for rent rental vacancy rate For Sale rented or sold occasional vacant New units mobile homes 2010 to 2014 720 28 692 550 403 147 142 38 19.6 44 20 23 17 720 22 2005 to 2009 8,267 273 7,993 7,098 5,182 1,917 895 223 10.4 172 37 301 163 2,391 528 2000 to 2004 9,250 295 8,955 8,206 6,319 1,887 748 214 10.1 123 47 234 130 (X) 914 1995 to 1999 8,948 298 8,650 7,906 6,045 1,861 744 210 10.1 99 30 285 120 (X) 1,694 1990 to 1994 7,206 301 6,905 6,264 4,766 1,498 641 132 8.0 125 52 198 134 (X) 1,090 1985 to 1989 9,014 284 8,731 7,889 5,176 2,714 841 338 11.0 89 42 226 147 (X) 927 1980 to 1984 7,715 241 7,474 6,605 4,135 2,470 869 264 9.6 108 48 262 186 (X) 1,013 1975 to 1979 13,579 402 13,177 11,805 7,298 4,507 1,373 454 9.1 144 90 415 270 (X) 959 1970 to 1974 11,176 424 10,752 9,535 5,608 3,927 1,217 402 9.2 95 73 369 278 (X) 1,062 1960 to 1969 15,405 472 14,933 13,596 8,679 4,917 1,338 406 7.6 185 79 359 308 (X) 631 1950 to 1959 13,455 331 13,124 11,905 8,548 3,357 1,219 283 7.7 195 71 288 382 (X) 98 1940 to 1949 7,836 283 7,553 6,624 4,172 2,451 929 239 8.8 88 54 191 358 (X) 49 1930 to 1939 5,536 140 5,396 4,705 2,697 2,008 691 192 8.7 72 27 150 250 (X) 63 1920 to 1929 5,323 93 5,230 4,612 2,598 2,014 618 181 8.2 64 42 118 212 (X) (X) 1919 or earlier 8,989 267 8,722 7,607 4,467 3,141 1,115 332 9.5 111 74 190 407 (X) (X)
What | When | Where | How | Splits | Schisms | Housing boom | Adam Rome's argument | Timothy Egan's argument | Sources
![]()
How can you accurately account for ecological assets and natural capital?
"The Evolution of the Conservation Movement, 1850-1920 documents the historical formation and cultural foundations of the movement to conserve and protect America's natural heritage, through books, pamphlets, government documents, manuscripts, prints, photographs, and motion picture footage drawn from the collections of the Library of Congress."
President Theodore Roosevelt's 1908 speech, "Conservation as a National Duty," Washington, D.C.
Third Wave: America's New Conservation, Conservation Yearbook No. 3 (Washington: GPO, 1966);
Stewart L. Udall, The Quiet Crisis. New York: Holt, Rinehart & Winston, 1963.
Marshes of the Ocean Shore, p. 155.
What | When | Where | How | Splits | Schisms | Housing boom | Adam Rome's argument | Timothy Egan's argument | Sources
Links:
Contents | Themes | Population | Sources