
 Meaning
 THEME
THEME
As long ago as 1798 the British political economist and clergyman Thomas Robert Malthus realized that people had more children than there were sufficient resources, especially food sources to feed all of them. Malthus proposed there were two very different rates of increase for population growth as opposed to a slower rate for the increase in the food supply.
He asserted that human populations were increasing exponentially through logarithmic or geometric progression in the absence of any apparent checks to their growth.
| Faster paced | More slowly paced | |
|---|---|---|
 |
 |
|
| Human population increase | growth of food supply | |
| Geometric progression | Arithmetic progression | |
| 1-2-4-8-16-32-64-128-256 | 1-2-3-4-5-6-7-8-9 |
Forty years later in 1838, the Belgian mathematician Pierre-François Verhulst was the first to describe mathematically a sigmoid curve for population growth that was constrained to an asymptote. This curve he called the "logistique" as opposed to the "logarithmique" of Malthus.
However, Malthus was also aware of the logistic relationship in his "principle of population" and so this curve is perhaps best described as the "Malthus-Verhulst logistic equation" (Berryman, 1992).
This logistic curve became a central theme throughout ecology --though largely ignored for more than 80 years-- until the Americans, Raymond Pearl and Reed resurrected the logistic formula in 1920 (Kingsland, 1991). Raymond Pearl was a statistician and he also called this relationship the "logistic curve" which is described by the differential equation:
dN/dt = rN[(K-N)/K] .... the same as dN/dt = rN(1-N/K),
in which:
N = the number of individuals in the population,
t = time,
r = the intrinsic rate of natural increase, and
K = the upper limit of population growth (the "carrying capacity").
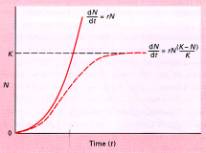
Figure 6.29 (Begon et al. 1996) Exponential and sigmoidal increase in density (N) with time (t) for continuously breeding populations.
The logistic relationship was used particularly extensively by fisheries biologists who developed population models to manage fish harvests and in some texts and papers the logistic is also called the Verhulst-Pearl equation to reflect its pedigree.
In addition to these single species uses, the logistic equation has also been used to describe interactions between two species. The Italian physicist Vito Volterra used the logistic in 1926 to model interspecific competition. He also modeled prey-predator interactions, but with a “mass-action” approach, and this work was mirrored at the same time in the USA by Alfred Lotka, a mathematician and demographer.
Thus this two-species model of predation is now known as the Lotka-Volterra predation model and provides a starting point for most considerations of predation, and despite the fact that this is not a logistic model it is simple to add a self-limiting, logistic term to the model.
Although Lotka did not work on competitive interactions to the same extent as Volterra (Kingsland, 1991), the logistic model of interspecific competition is also widely known as the Lotka-Volterra competition model.
This page was created, by J. Siry, for use in classes about population for college students..
