 Maps
Maps 
Navigating
![]() The
physical, biological, and cultural portrait of the USA.
The
physical, biological, and cultural portrait of the USA.
![]()
sections | education | growth | sea level | area | migratory patterns | vegetative cover
![]()
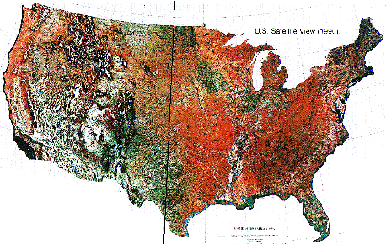
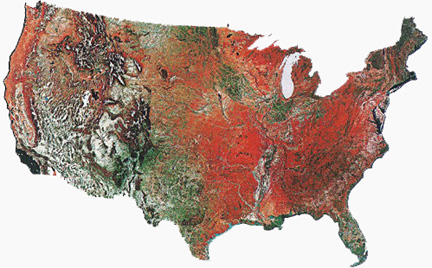
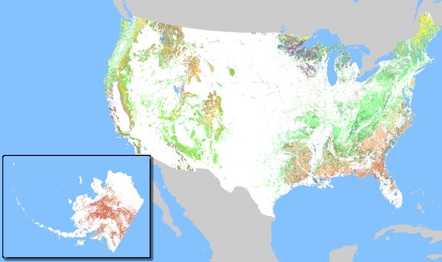
What is the vegetation and population of the US like?
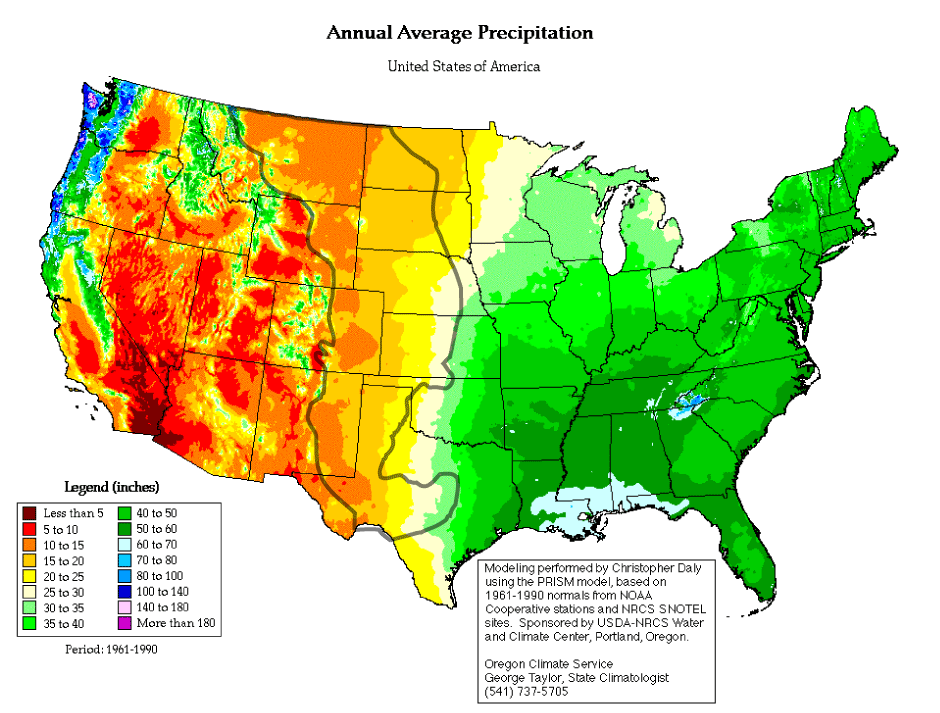
Contrasts: western versus eastern conditions.
The line drawn here is the hundredth meridian.
• Beyond the 100th meridian the amount of rainfall drops to below an amount that can sustain agriculture.
• The arid regions lie between this meridian and the coastal ranges of the Pacific ocean.
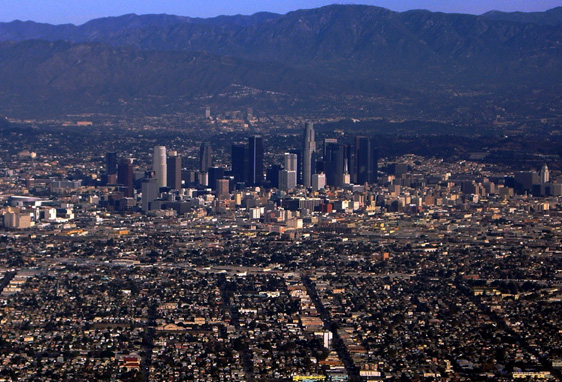
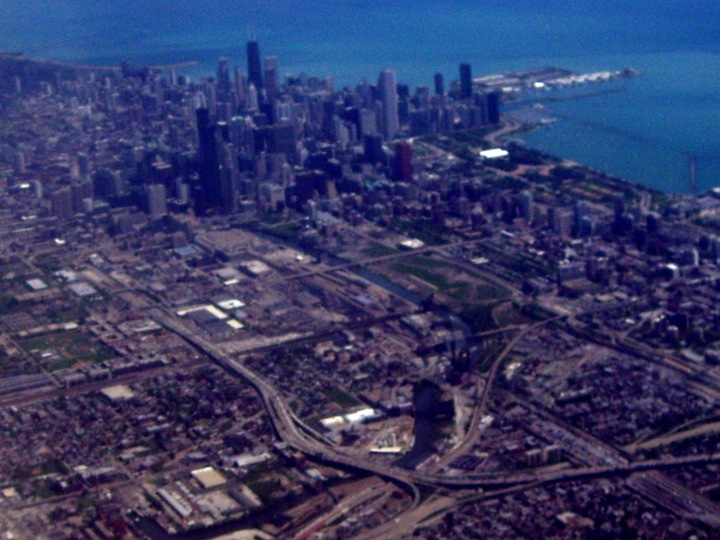
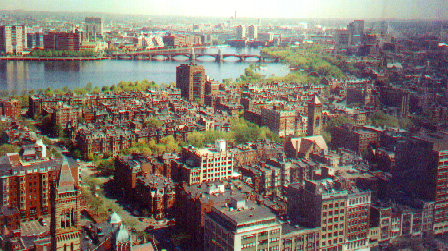
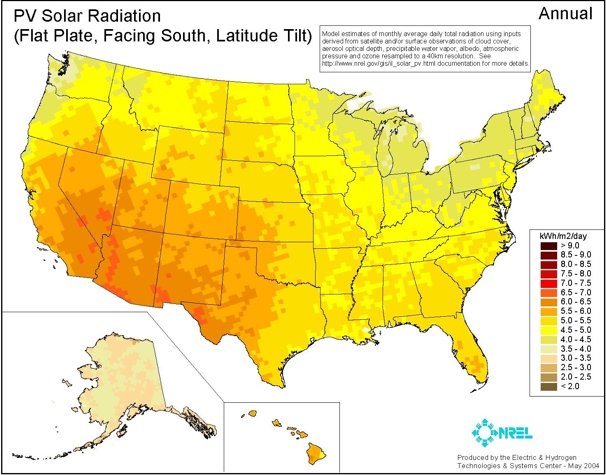
Comparing the east and the west: radiation, precipitation, vegetation & density
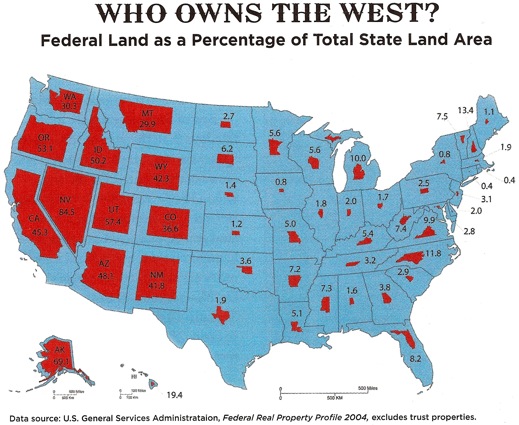
Los Angeles, CA. Chicago, Illinois Charles River, Boston, Mass. Western US Central US Eastern US Ownership and the public domain
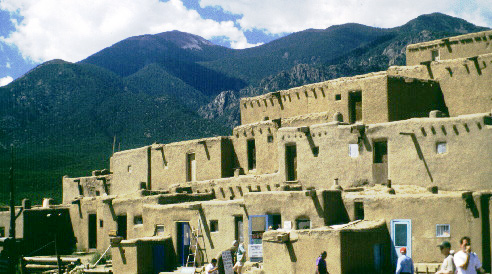
Taos pueblo, New Mexico, First Nations' land.
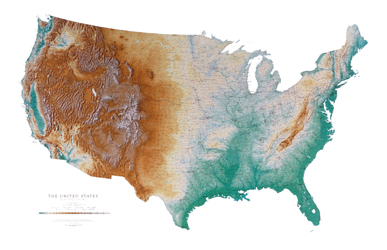
Comparing the east with the west: topographical elevation and urbanization:
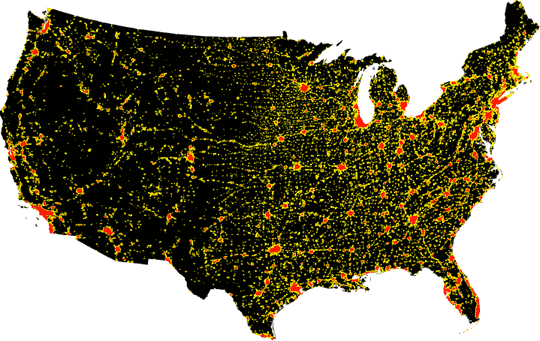
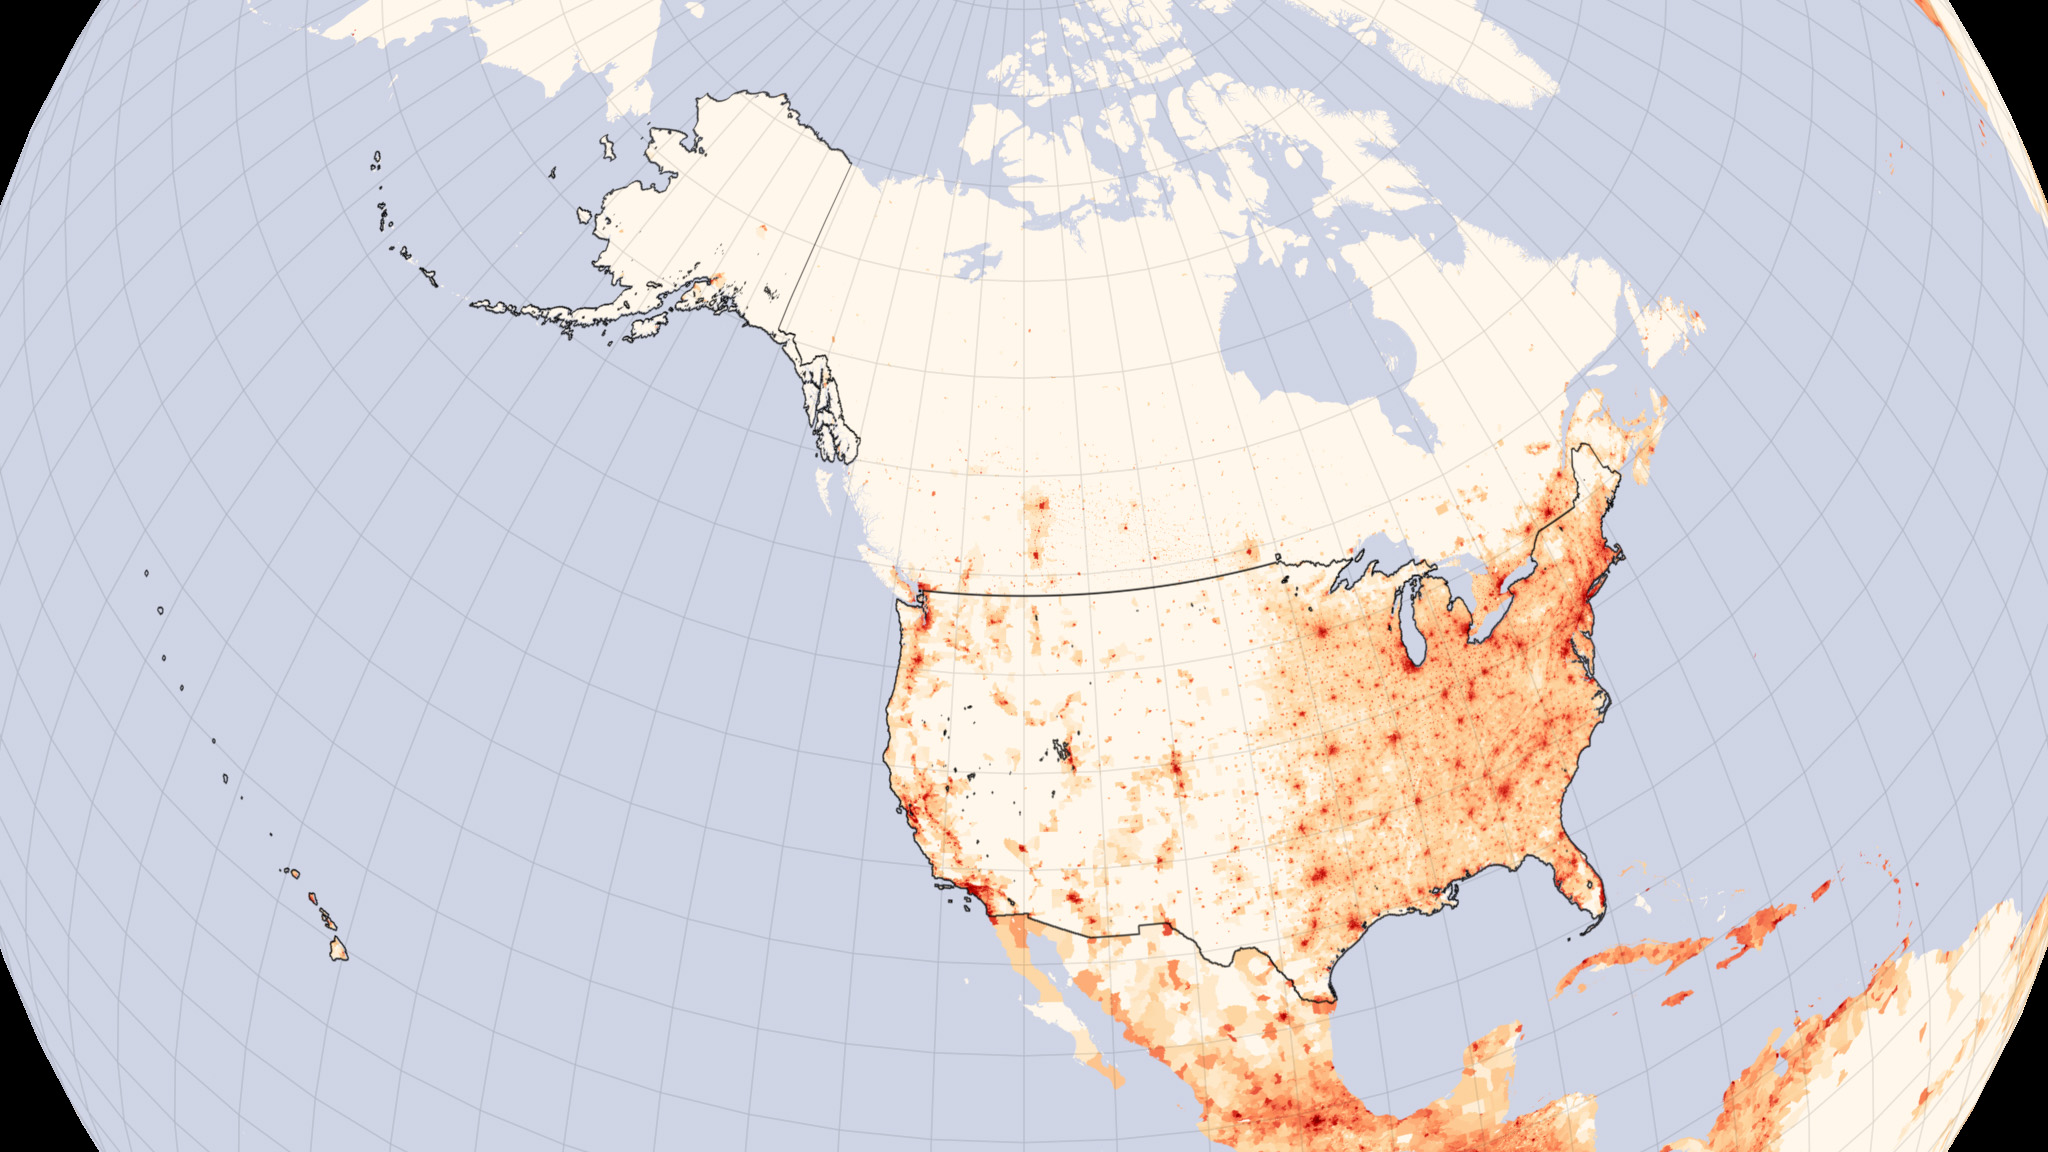
Geophysical map compared to a population centers map of the lower forty-eight states of the United States.
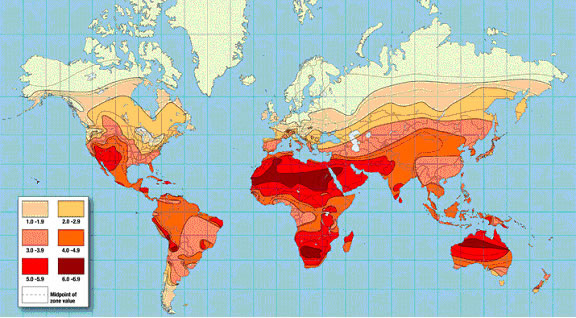
Solar irradiance is the amount of sunlight available annually and differs by sections.
Orange and red are the sunniest regions in terms of days per year of exposure to solar radiation.
The sectionalism evidenced here is north, south, & west.
Red color represents dense, urban areas and orange less dense areas with recent migration, white is an absence of dense populations.
sections | education | growth | sea level | area | migratory patterns | vegetative cover
Education expenditures per capita:
sections | education | growth | sea level | area | migratory patterns | vegetative cover

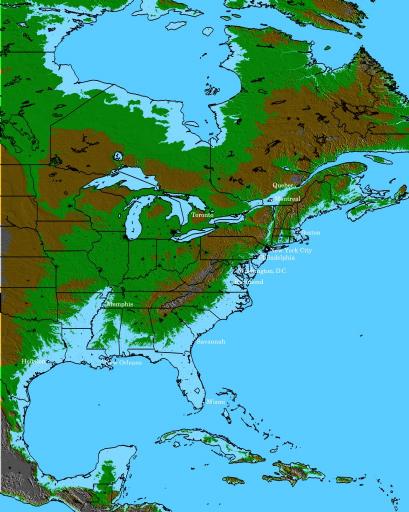
After a 600 foot, or 200 meter, rise in sea level, this is how the country will look. This happened 20 million years ago. Today, abrupt climate change means coastal erosion.
Weather map of the US showing the size of hurricane Jean, 2004.
Population growth and coastal density rates of population increase, 1940-2004.
sections | education | growth | sea level | area | migratory patterns | vegetative cover
Growth areas of the US. Mobility, 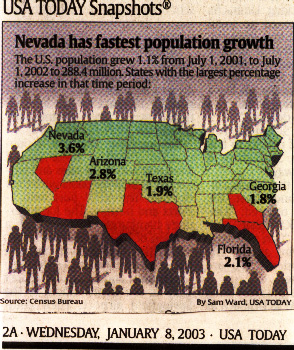
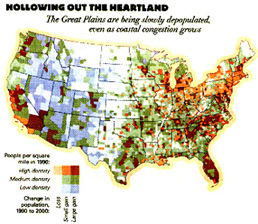
where people are moving from (emigre) and moving to (immigrants). Often referred to as a sun belt, among the fastest growing regions of the nation.
sections | education | growth | sea level | area | migratory patterns | vegetative cover
Size or areal extent matters: the USA is the third largest population on Earth and third in extent.
Only Canada and Russia exceed the USA in extent of territory or area.
sections | education | growth | sea level | area | migratory patterns | vegetative cover


